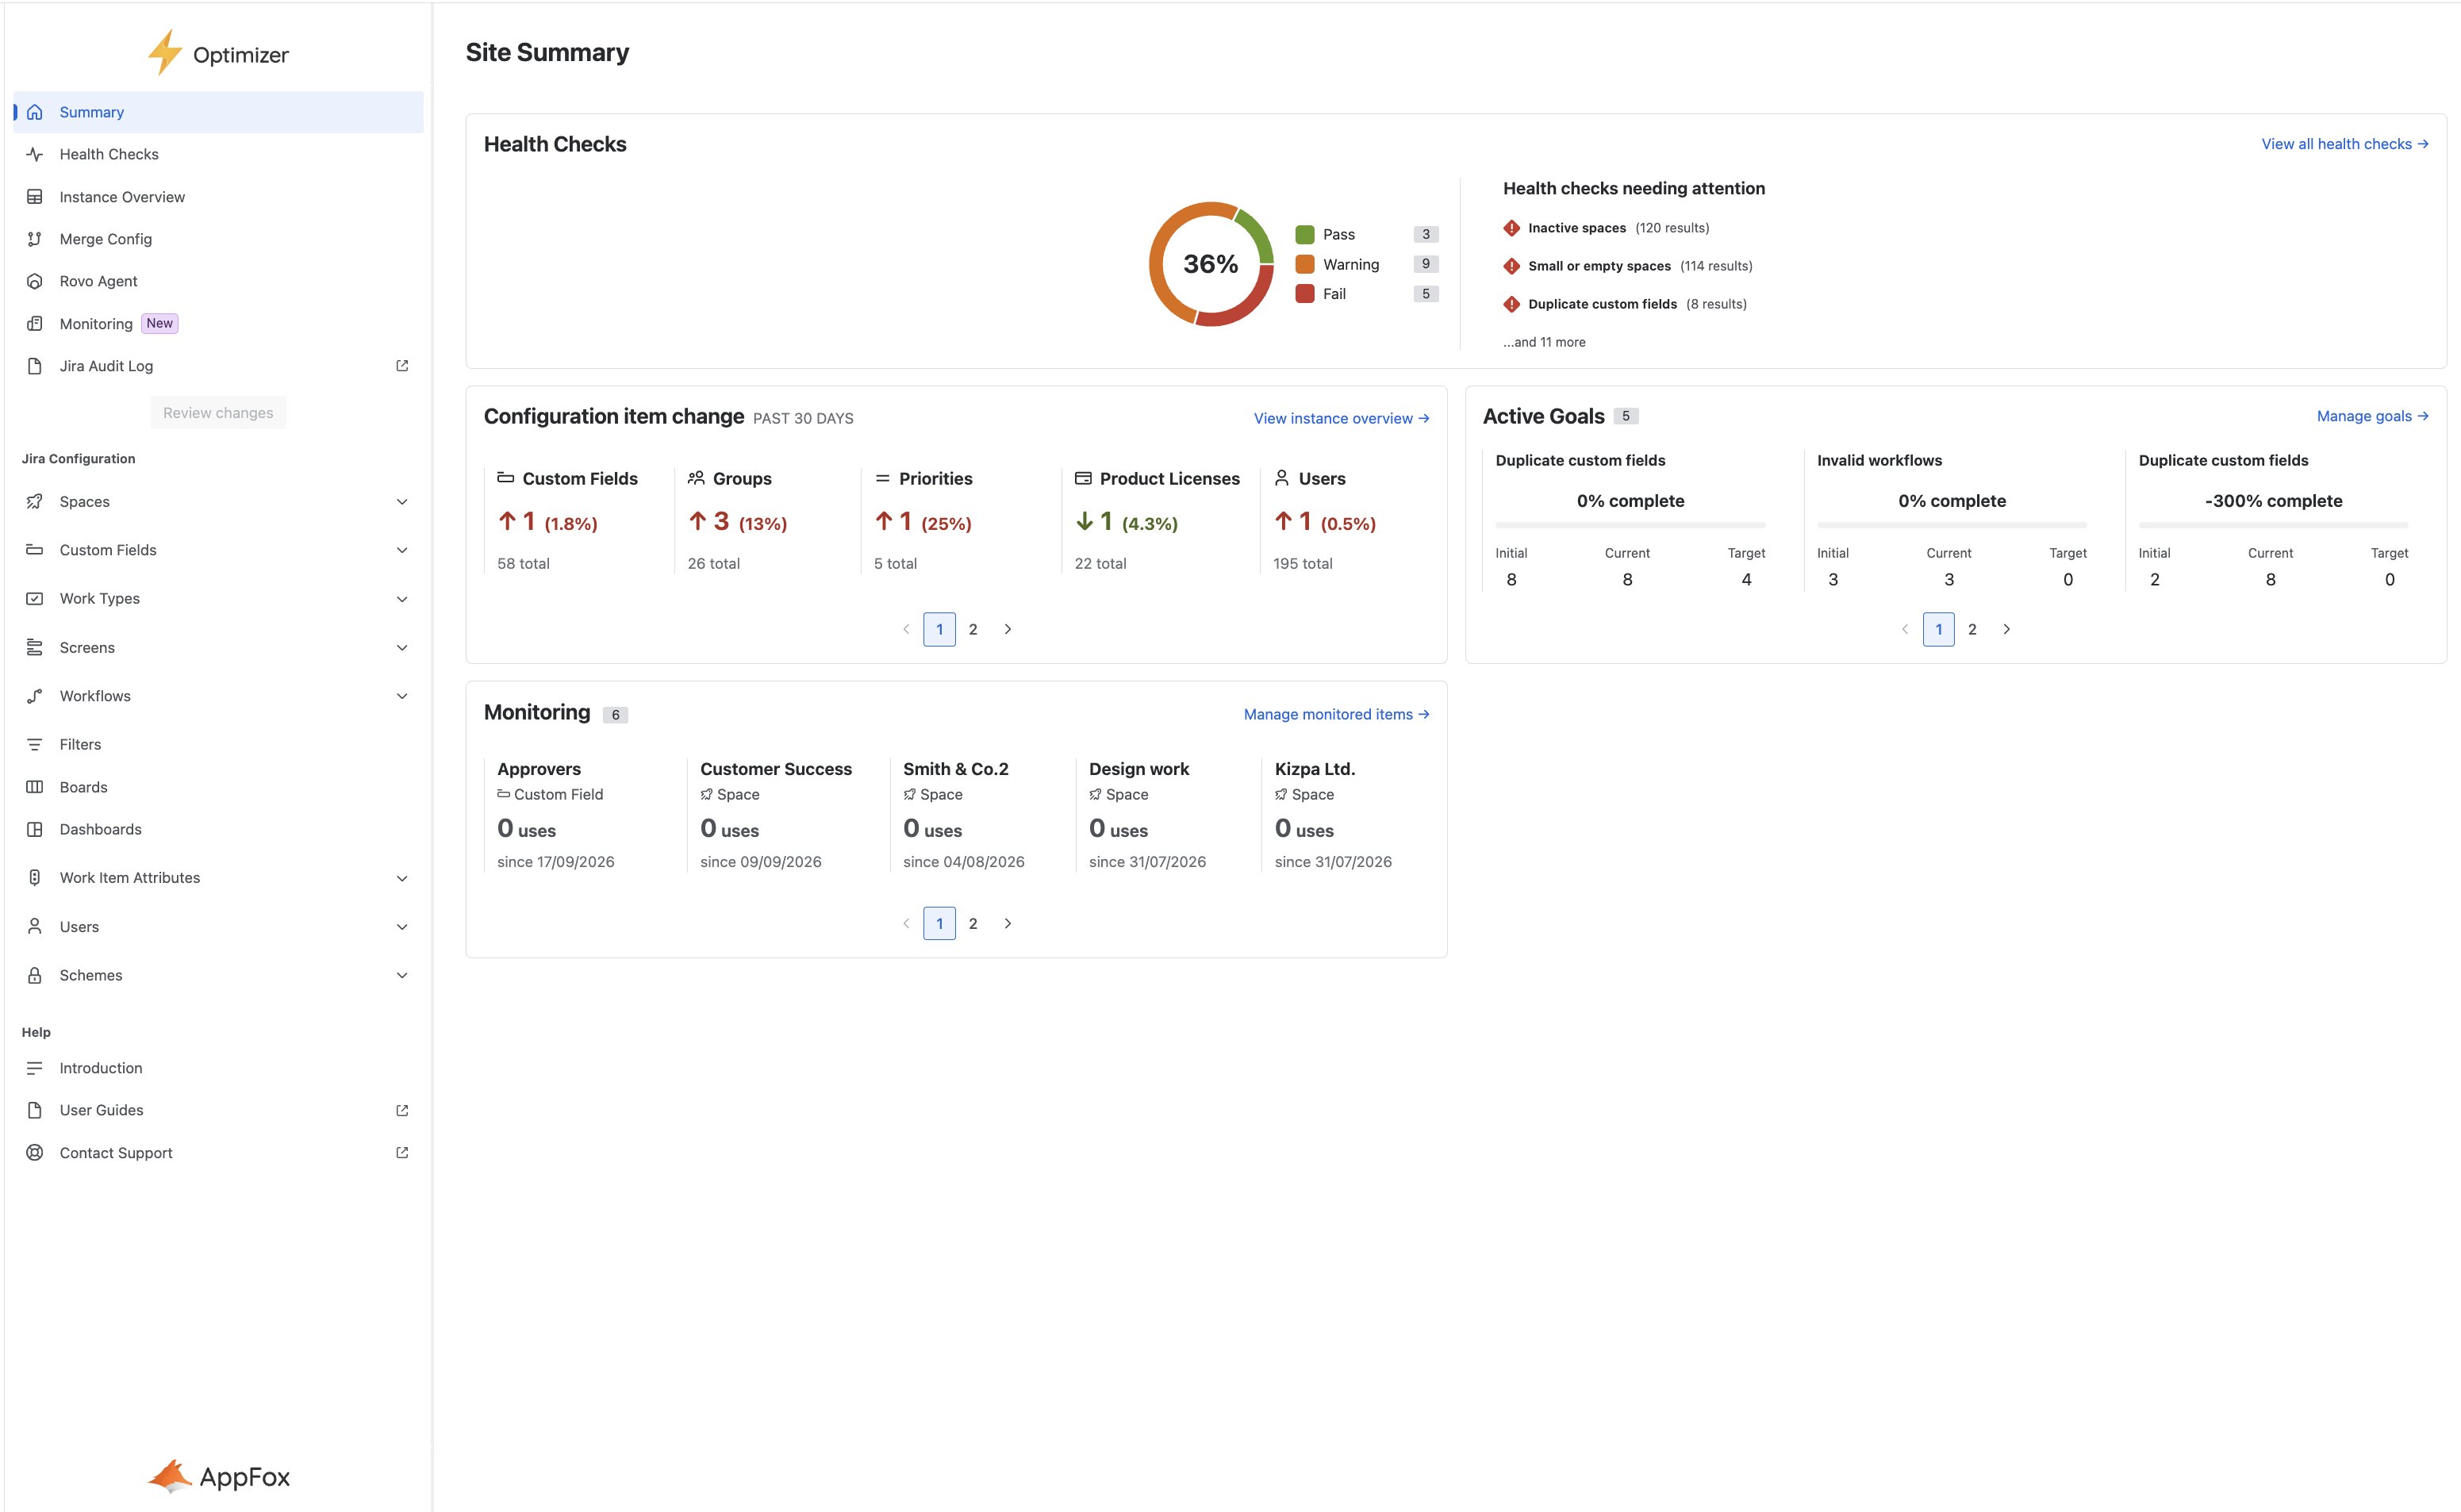
The Site Summary in Optimizer is the first page an admin sees. It gives an overview of your instance’s health by showing key changes from Optimizer’s features: Health Checks, Monitoring, Configuration Item Change and Active Goals. This single page lets users see changes and jump directly to the relevant feature pages for details or changes.
This guide explains the page options and how to use them to make the most of this page.
Overview
Health Checks / Health Checks Needing Attention
The first tab on the Summary Page contains key information on your instance's health check score: Health Checks and Health Checks Needing Attention.
Health Checks tab shows a pie chart of the results from your last health check scans. The chart shows how many checks passed, failed or issued warnings. The pass rate appears at the centre of the pie, and the numerical breakdown appears in the chart key. This gives you a quick view of the last scan results when you open Optimizer. To learn how to run a health check scan and display its results in the graph, consult the Health Checks page.

Health Checks Needing Attention lists the health checks that need the most attention. It shows the top three fails or warnings (fails take priority) with the largest number of issues. This helps you identify which areas of your instance need improvement and use your time efficiently. If more than three checks have issues, greyed text appears at the bottom showing the number of additional checks to review. The final option on the tab, ‘View all health checks’, opens the Health Checks page in Optimizer.

Configuration Item Change (Past 30 Days)
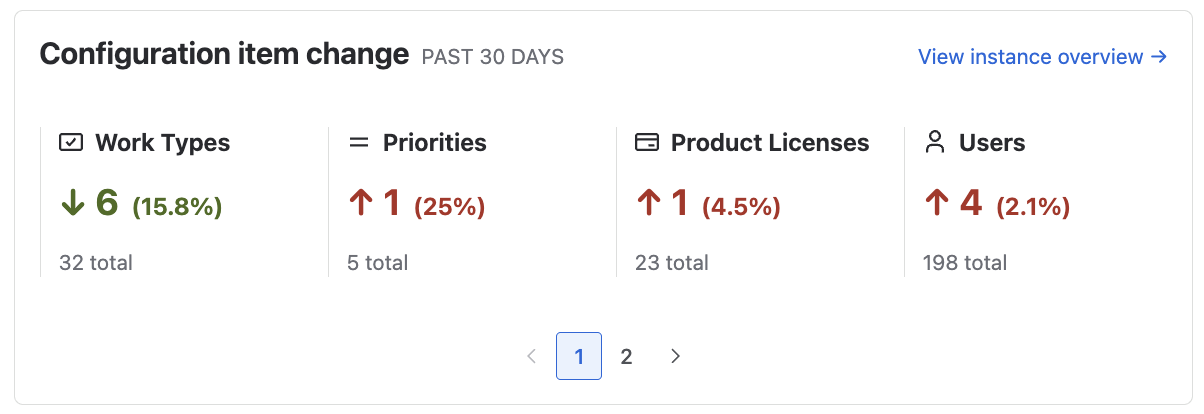
Configuration Item Change (Past 30 Days) tab shows changes in the sizes of the key configuration data that make up the Jira instance, as shown on the Jira Instance Overview page.
This tab tracks changes over the last 30 days and shows the percentage change for each key configuration item. Items that decrease in size display a down arrow and green text; items that increase show an up arrow and red text. The tab lists all tracked configuration items that changed within the last 30 days.
This lets you quickly see how key areas of your instance have changed over the past 30 days without comparing daily results manually.
The ‘View instance overview' button opens the Instance Overview page. More information is available here Jira Instance Overview
Active Goals
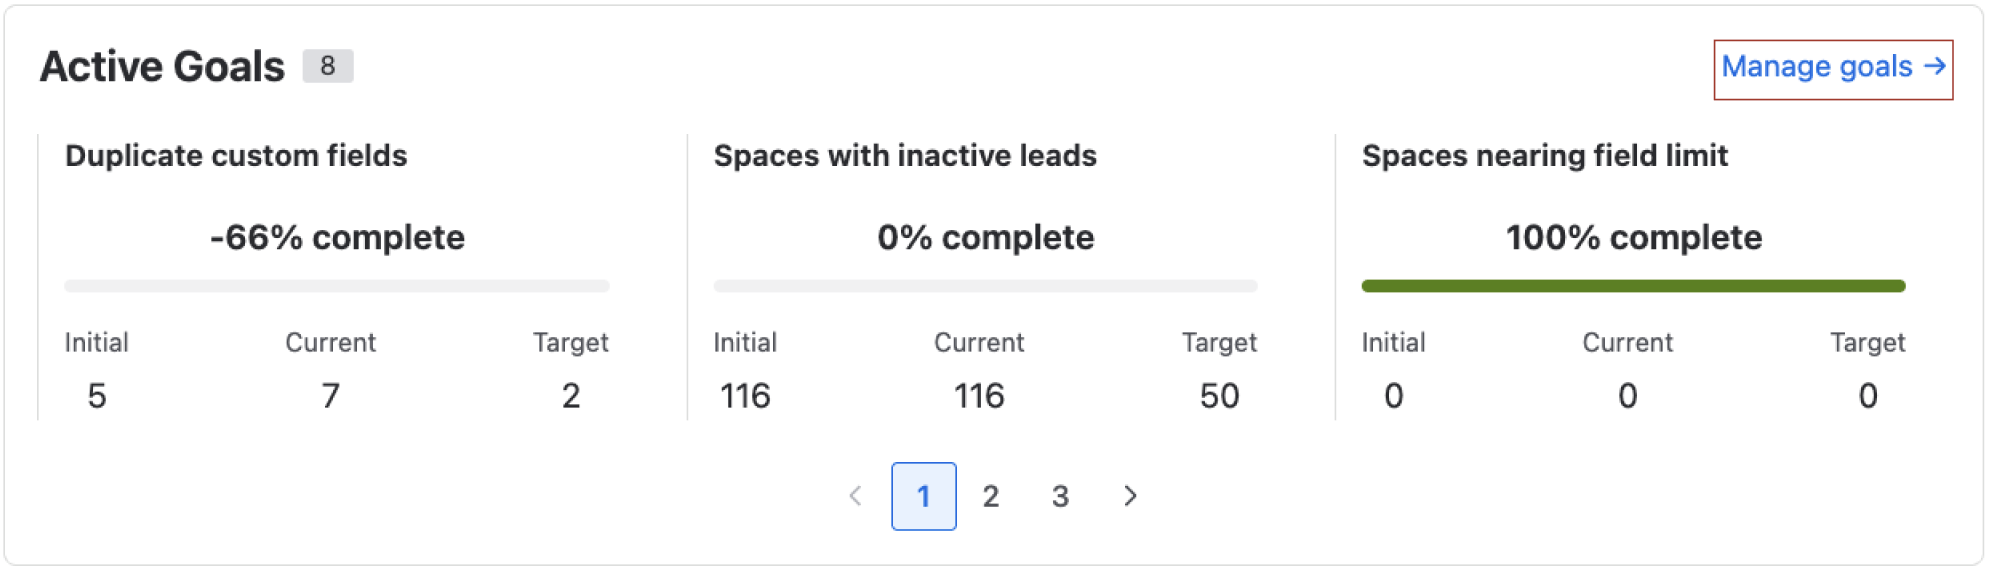
The Active Goals tab shows the goals you have created. From the Site Summary Page you can view active goals and a progress bar that displays progress toward your Health Check goals. It also breaks down the initial number of detections when the goal was created, the current number, and the target number.
To create new goals or mark achieved goals as complete, click the Manage Goals button. This opens the Goals page.
Monitoring
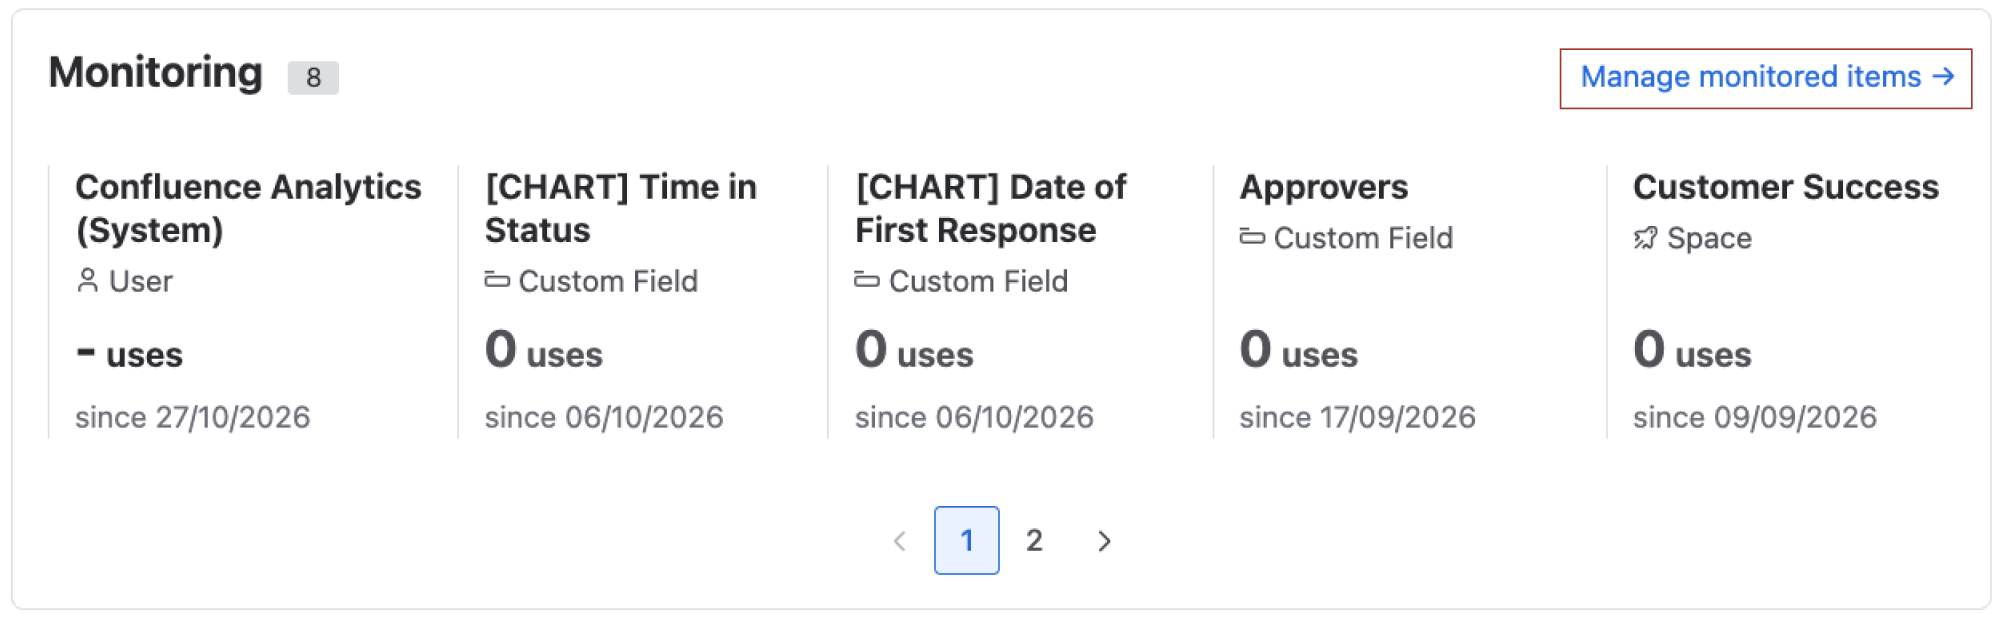
The Monitoring tab will allow a user to see which configuration items you have pinned to be monitored. Once a item has been pinned in the Monitoring page, it will be displayed in the tab with number of usages clearly shown.
To reach the Monitoring page from the Site Summary Page, you will need to click on the Manage monitored items button in the top right of the card.