-20250819-084018.svg)
Instance Overview
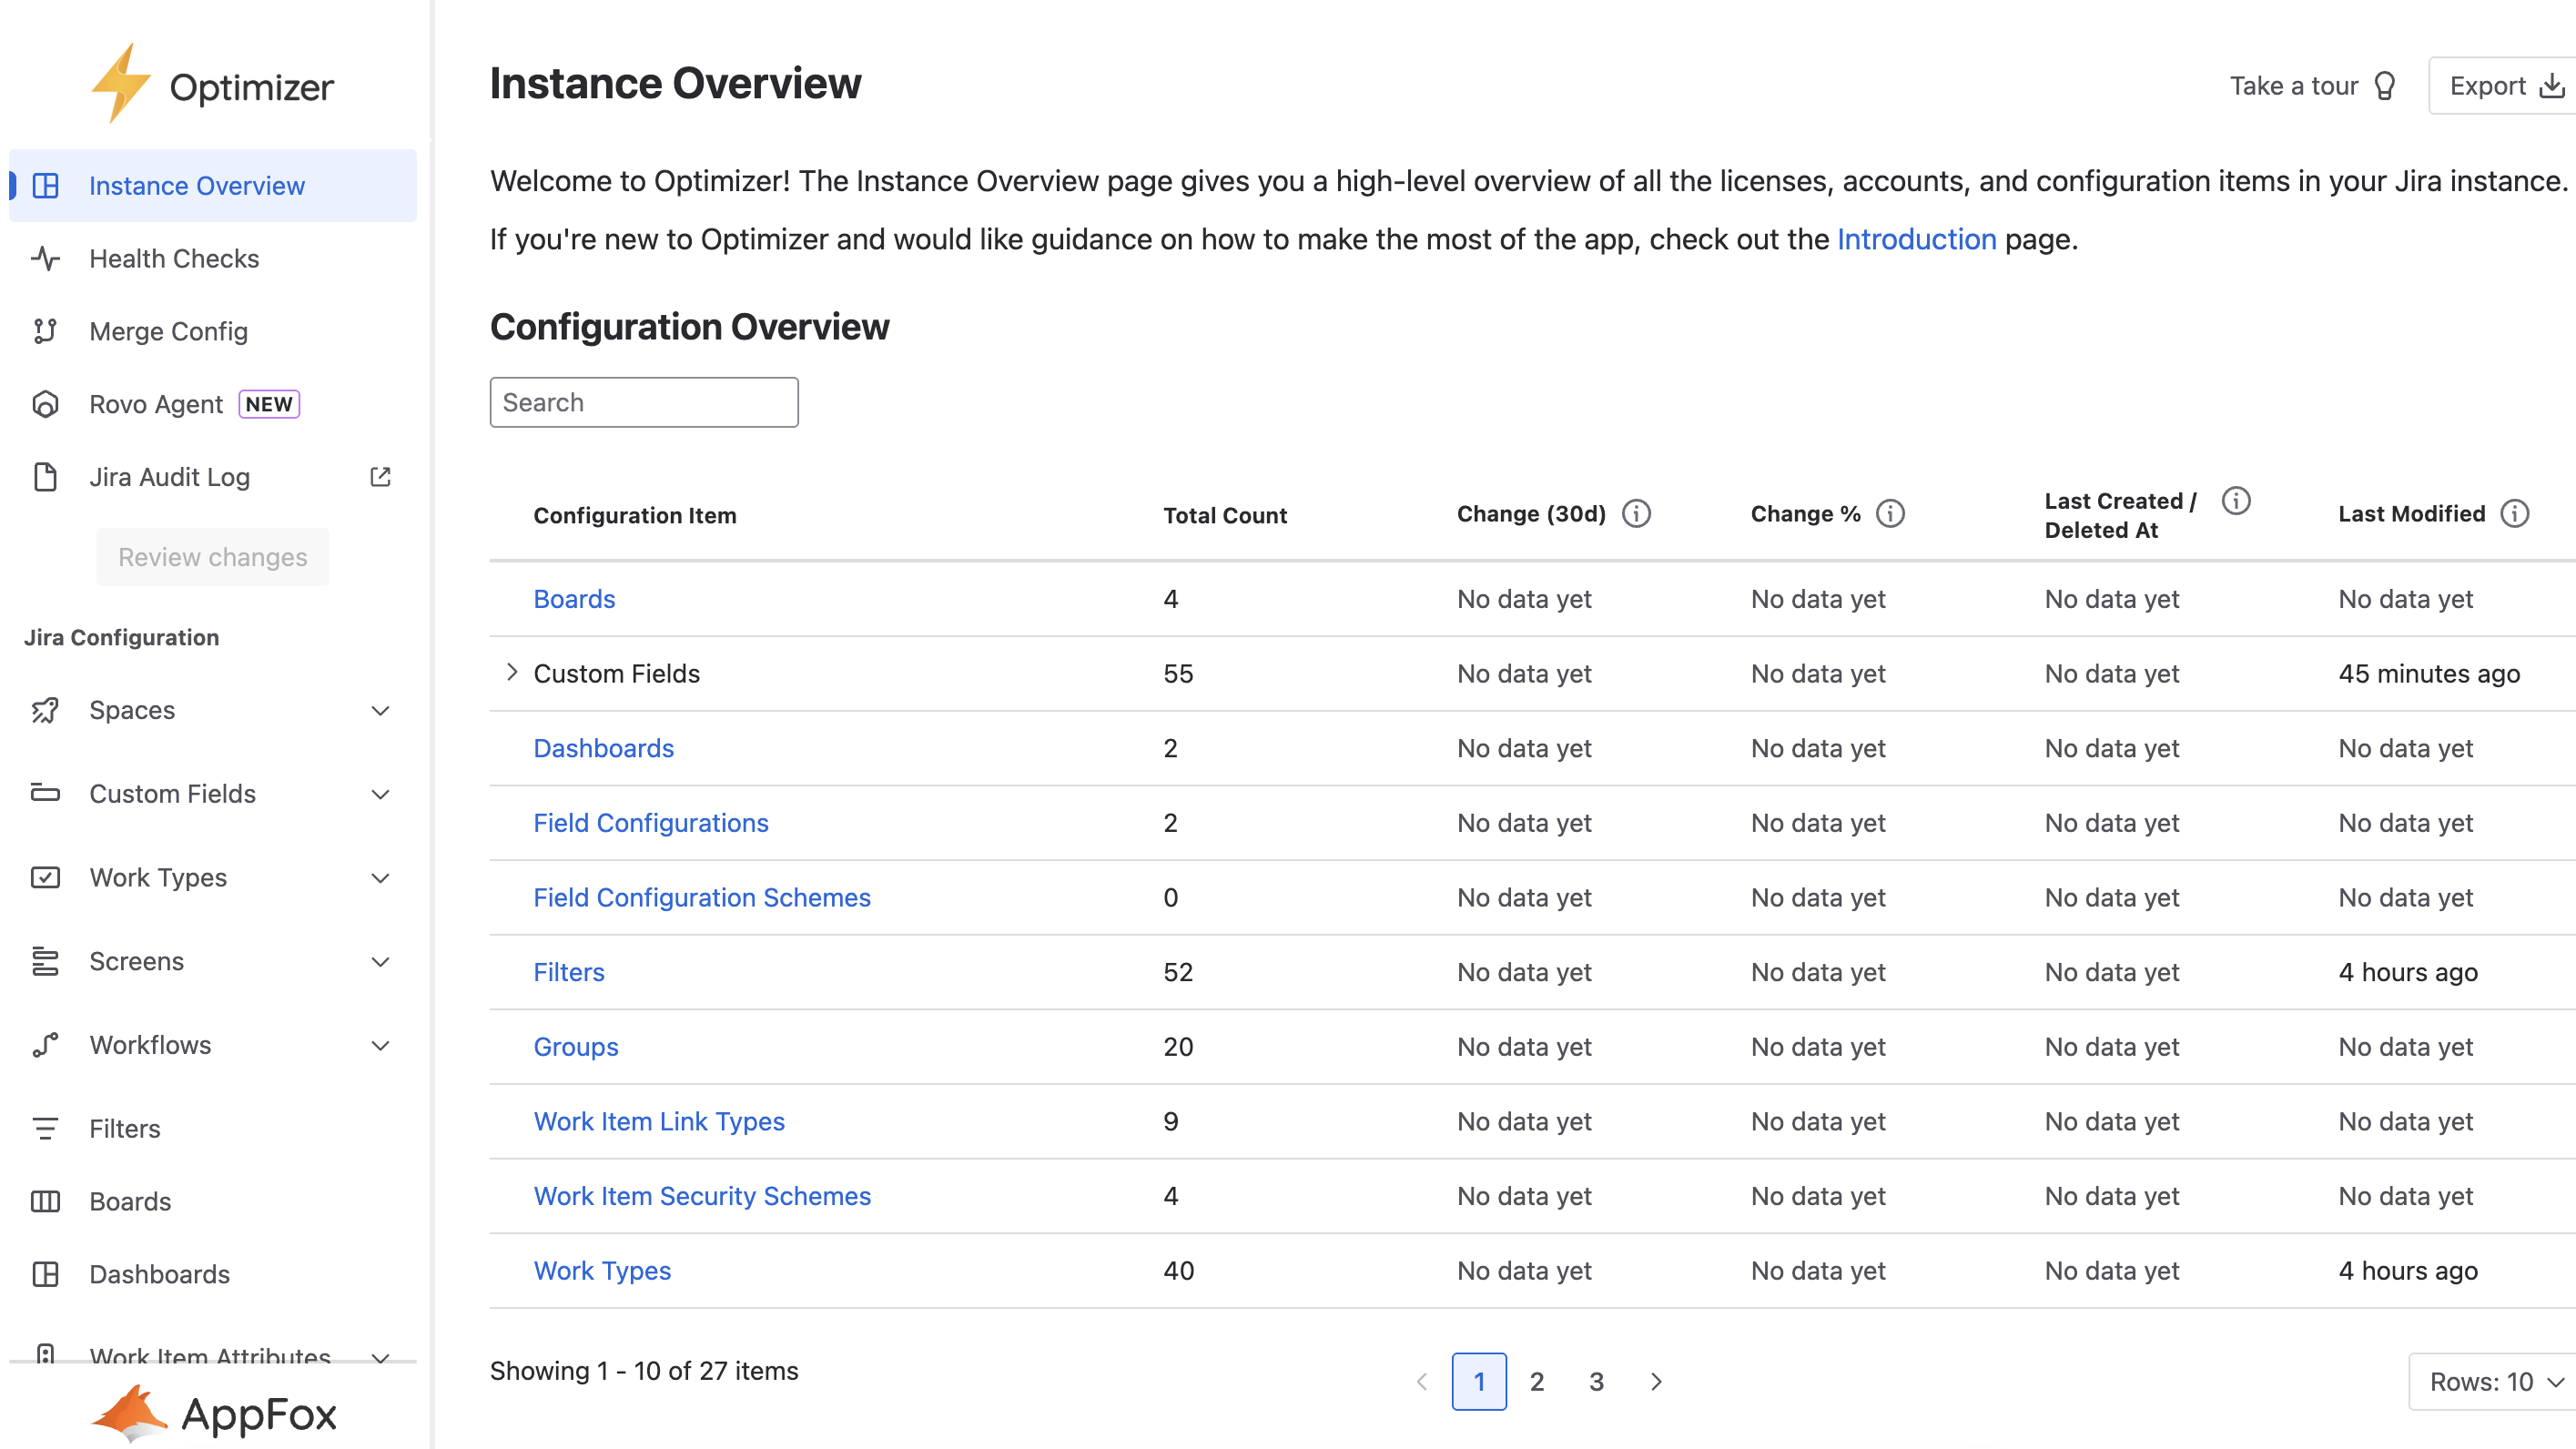
The Instance Overview in Optimizer provides a single, comprehensive table summarising all of the critical configuration data in your Jira instance. The Configuration Overview table gives you instant visibility into the scale, changes, and activity across key configuration objects, helping you monitor and manage your Jira setup efficiently. Instead of navigating between multiple widgets or dashboards, you can view your instance in a unified, searchable and easy-to-navigate table!
Once you open the Optimizer app, the Instance Overview is the first screen you’ll see:
-
Click the Apps menu in the left-hand side bar of Jira.
-
Select Optimizer.
-
If you’re already in Optimizer, you can return to this view at any time by clicking Instance Overview in the left‑hand navigation.
Configuration Overview Table
The table rows show the type of configuration object, including boards, custom fields, dashboards, groups, projects and other Jira configuration items listed in your instance.
Clicking on the blue text in the first column in each of these rows will take the user to the smart table for that object.
Some rows can be expanded to show related items grouped underneath (for example, “Custom Fields” with sub‑rows for ‘Active’ and ‘Trashed’).
-
The columns give you information about the following:
-
Total Count: The current number of each object type in your instance
-
Change (30d): Net change in the number of items over the last 30 days
-
Change %: Percentage change over the last 30 days
-
Last Created / Deleted At: The most recent creation or deletion date for each object type.
-
Last Modified: The most recent modification date for each object type.
You can use the search bar above the table to quickly locate specific configuration objects. Pagination controls are available if your instance contains many configuration types.
How to Use
-
Understand your configuration at a glance: See how many items you have for each configuration type and how actively they’re being changed.
-
Spot fast‑growing or risky areas: Use the 30‑day change and percentage change columns to find configuration areas that are growing quickly, which may need review or standardisation.
-
Gain visibility over your activity: The “Last created / deleted at” and “Last modified” columns show which configuration types are actively being updated, helping you to monitor current activity but also identify historical clutter.
-
Prioritise clean‑up and optimisation: Large counts, rapid growth, or frequent recent changes can all signal areas worth cleaning up, consolidating, or reviewing with your team.
-
Navigate to the details you need: Use the search bar to filter to a specific configuration type, then drill down from the table into detailed views to investigate or take action.
Need support? We’re here to help 🧡
If you have any questions about Optimizer or would like to speak with us, please don’t hesitate to reach out to our Customer Support team.