-20250819-084018.svg)
This guide walks you through how to use Health Checks in Optimizer to find and fix common problems in your Jira configuration, such as unused custom fields, duplicate items, and inactive spaces.
You'll learn how to run checks, read your results, take action on flagged items, customise checks to suit your organisation, and track your progress over time.
Before you start
-
Health Checks is available in all editions of Optimizer. Some features (unlimited history, CSV/PDF export) require the Advanced edition.
-
Health check settings are shared across all users on your instance. Any changes you make will apply for everyone.
-
Make a habit of reviewing your health check results regularly. This helps you spot trends early, track progress against your goals, and share improvements with stakeholders using the export feature
What you’ll find on the Health Checks Page
You can access the Health Checks page from the left-hand navigation bar in Optimizer.
When you open the Health Checks page, you'll see an overview of the following information at a glance:
-
A searchable, filterable table of all your health checks
-
A health score chart summarising passes, warnings, and failures
-
A summary of your Active Goals
-
A Health Check History summary panel
The main table lists each health check with the following columns:
-
Health check: the name of the check (for example, Spaces, Custom Fields, Work Types).
-
Status: Pass, Warning, or Fail, shown with an icon.
-
Results: how many configuration items were found by the check.
-
Last run: when the check was most recently run
-
Actions: a button to open that health check and view its details.
You can use the Search bar to find specific health checks by name, and the Filter button to narrow the list to particular statuses or categories.
Run your Health Checks
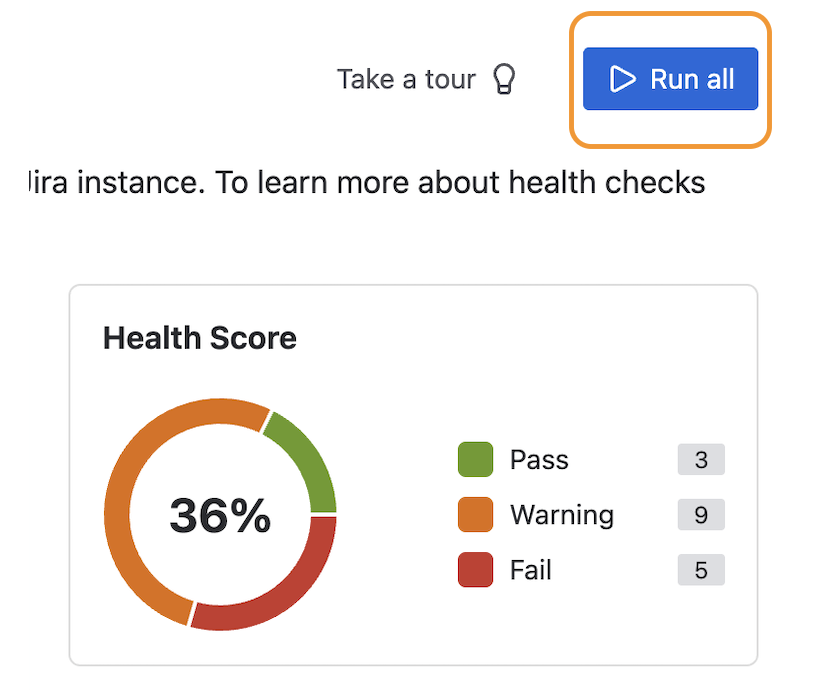
To run all health checks at once, click Run all in the top‑right corner of the Health Checks page (marked out in orange below).
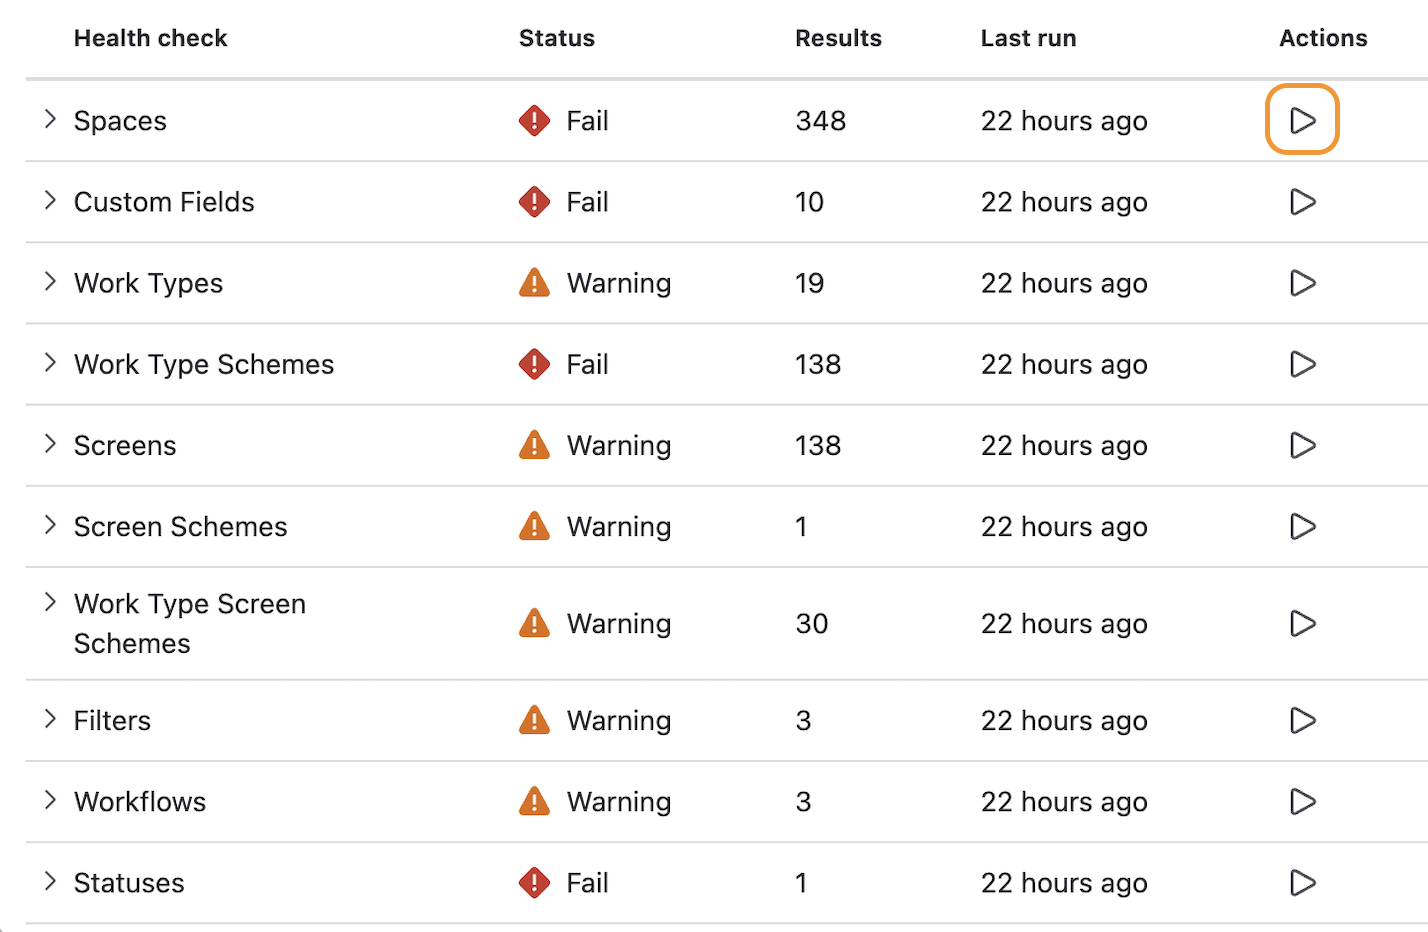
You can also run an individual health check by clicking the Run icon in the Actions column for that row (marked out in orange below).
While health checks are running, you can move to other parts of Optimizer and the checks will continue to run in the background. If you leave Optimizer entirely or refresh the browser tab, any in‑progress run will be lost and you will need to start the checks again.
View your Health Check results
Once your checks have finished, review the results in the table. Each check will show one of three statuses:
-
Pass: no problems were found for this check.
-
Warning: an area to investigate where there is likely room for improvement.
-
Fail: an issue that could negatively impact your instance or end users (for example, by creating a significant maintenance burden) and should be addressed.
The Results column shows how many items in the Health Checks Table were found by the check.
The Last run column shows when the check was last run.
If you change configuration in Jira and the numbers no longer look up to date, re‑run the relevant checks so the results match your current data.
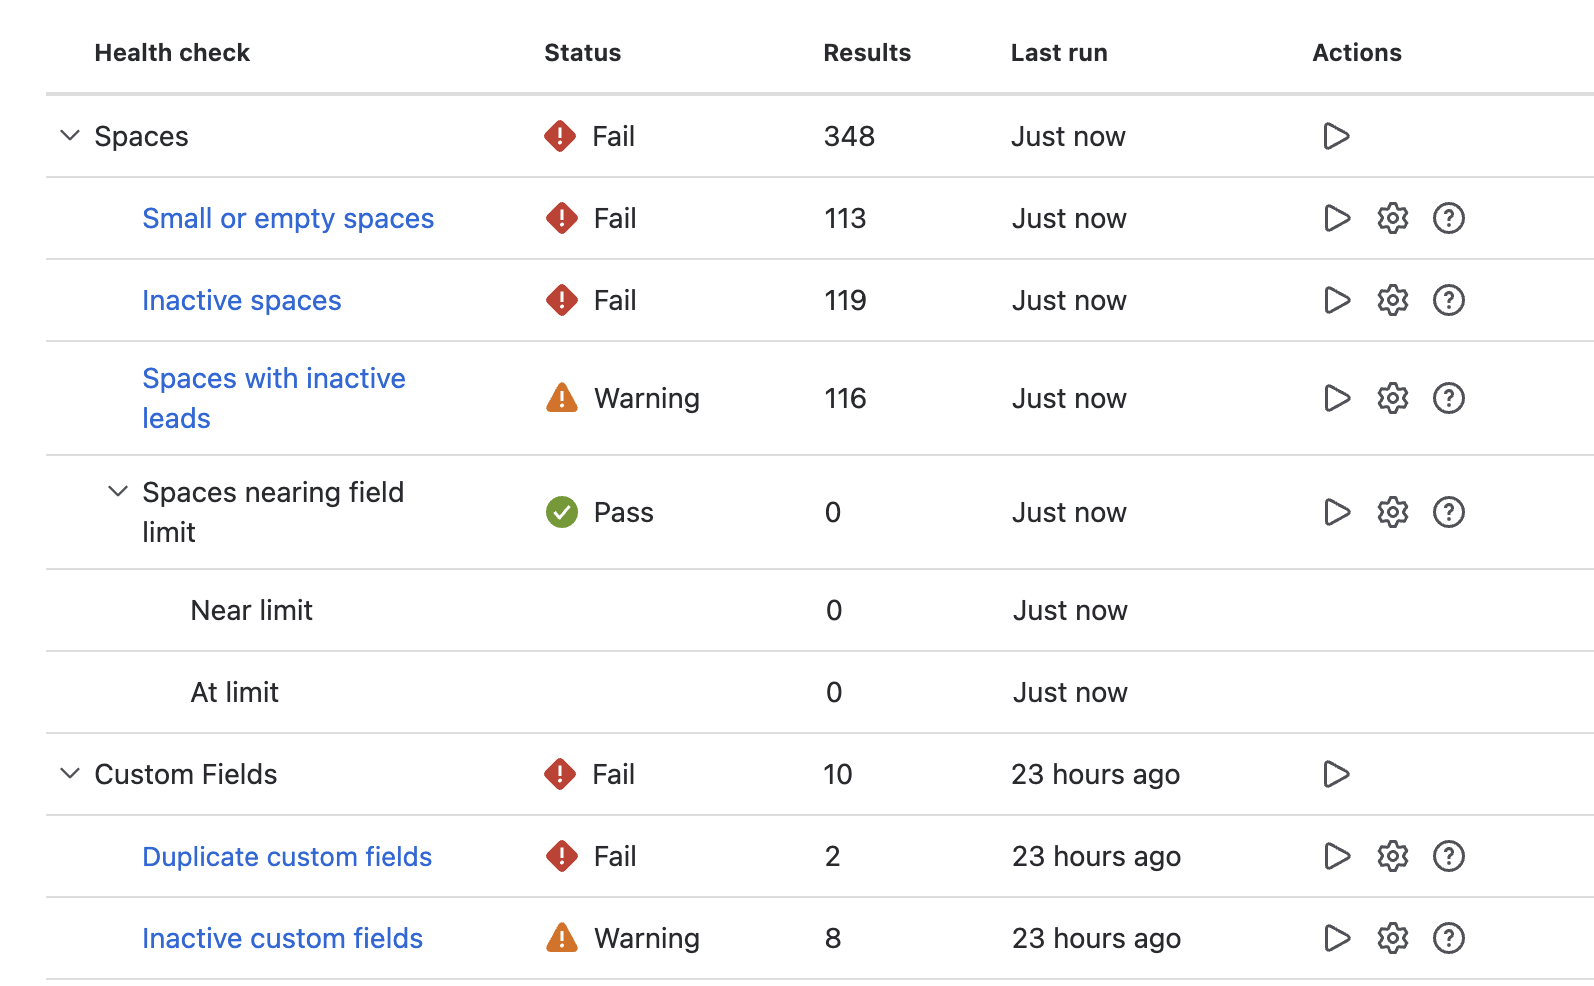
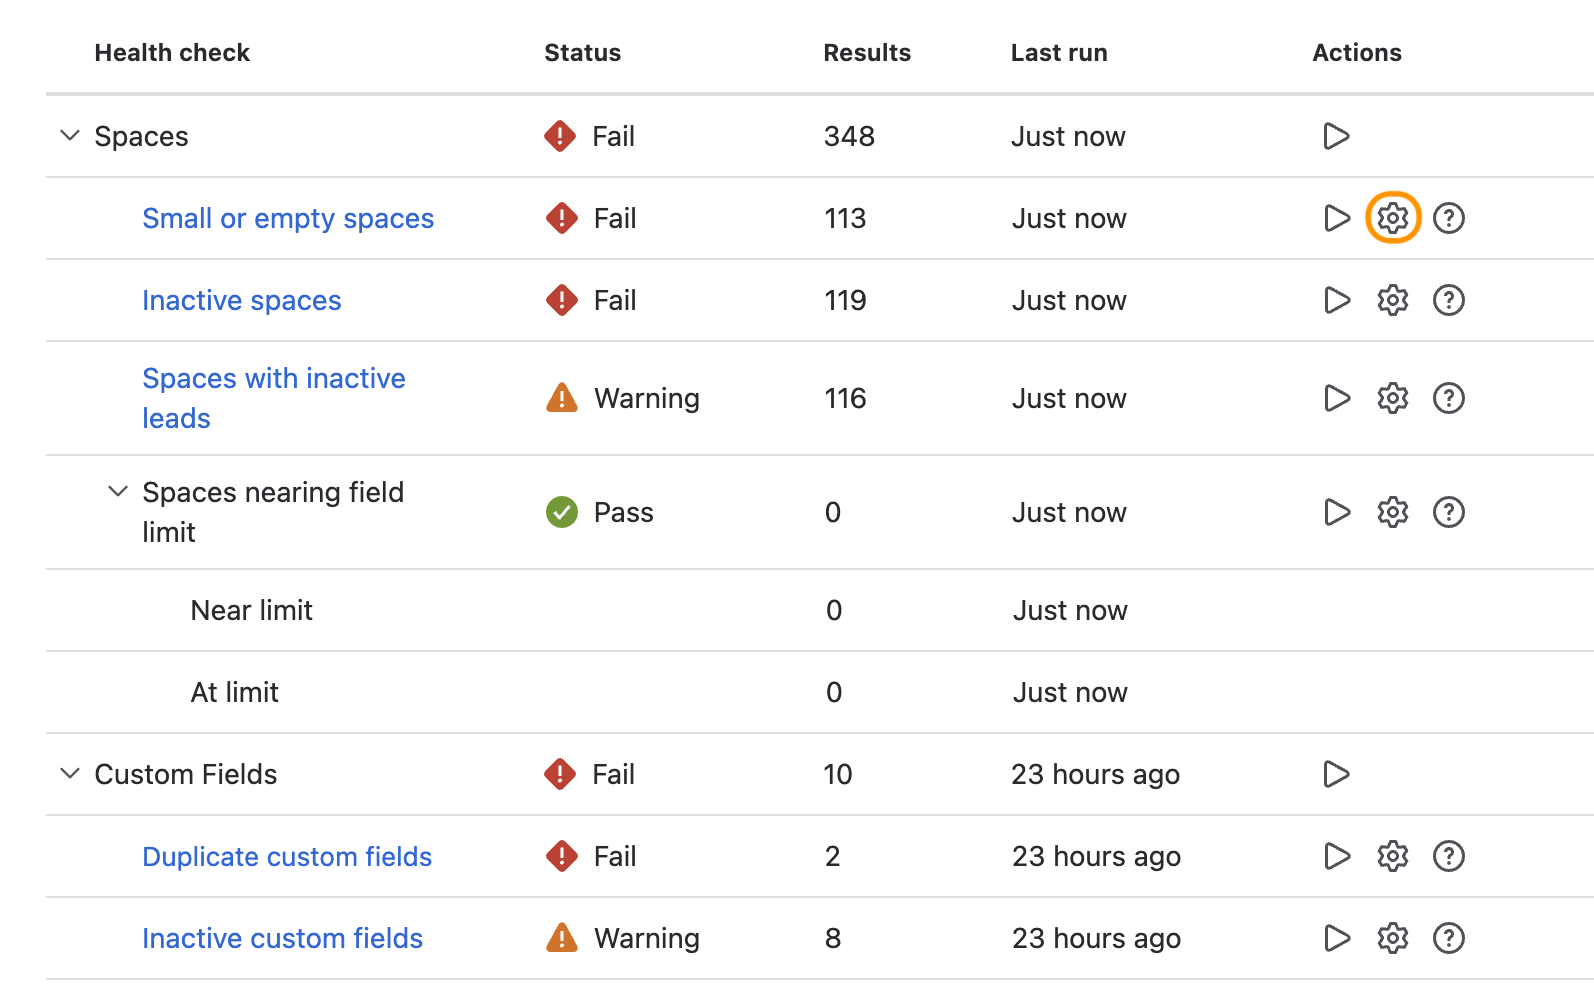
The table rows expand to show you a more detailed break down of your health score as you can see here. In the screenshot below, for example, the Spaces health check row expands to show you the specific health checks for the number of small or empty spaces, inactive spaces, or spaces with leads.
Action your Health Check results
To take action on flagged items, click the Results link for a health check. This opens a Smart Table showing the specific items identified.
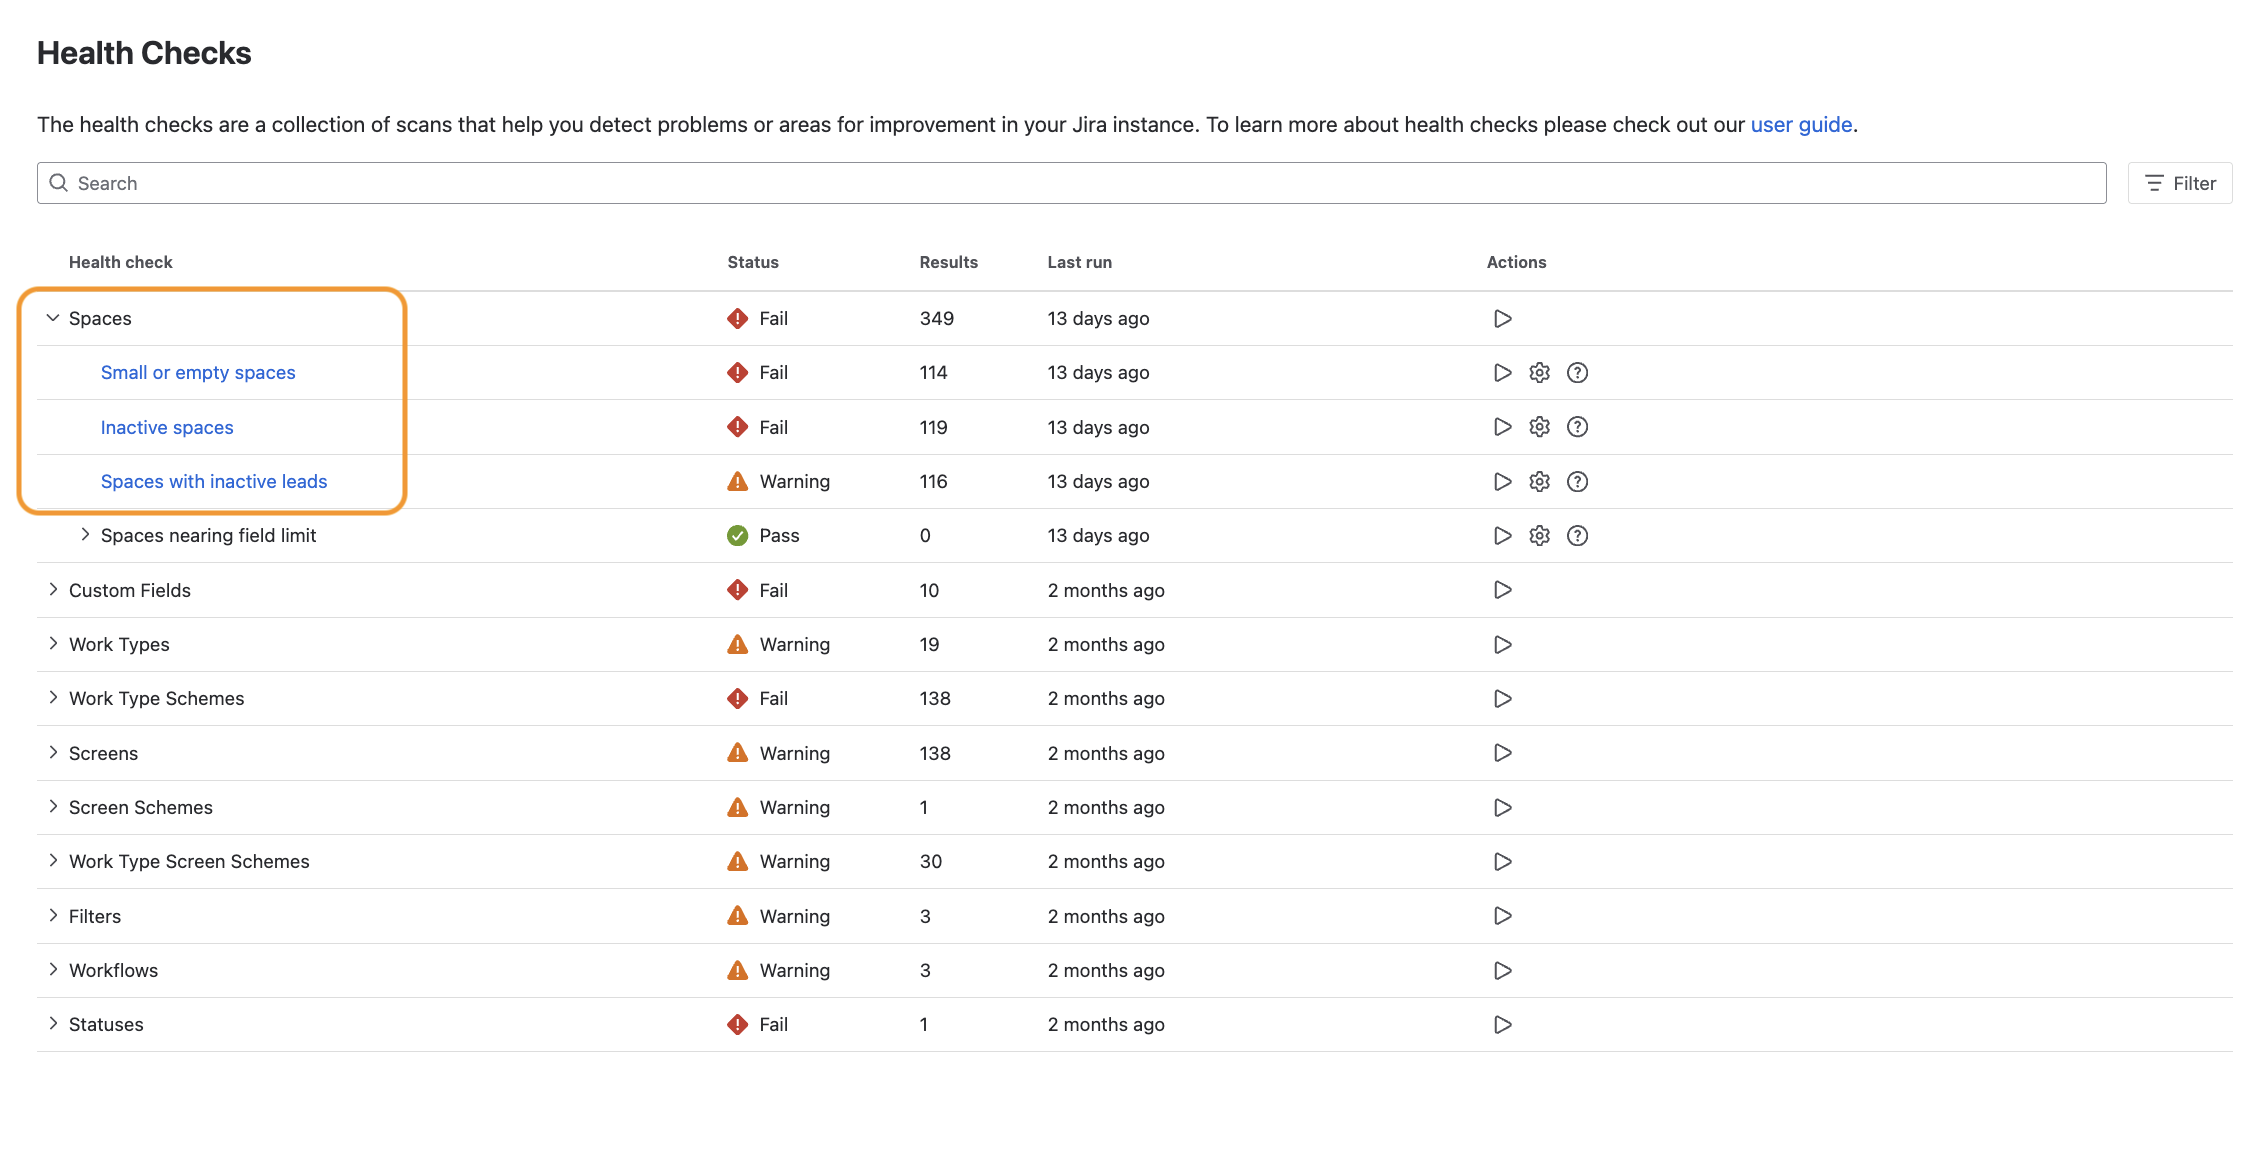
The screenshot below shows that you can click on ‘Spaces’ to show different Smart Tables. Clicking on any row with blue text will take you to that particular Smart Table.
The screenshot below shows you an example of the ‘Small or empty spaces’ Smart Table. You can find out more about how to use Smart Tables here: Smart Tables .
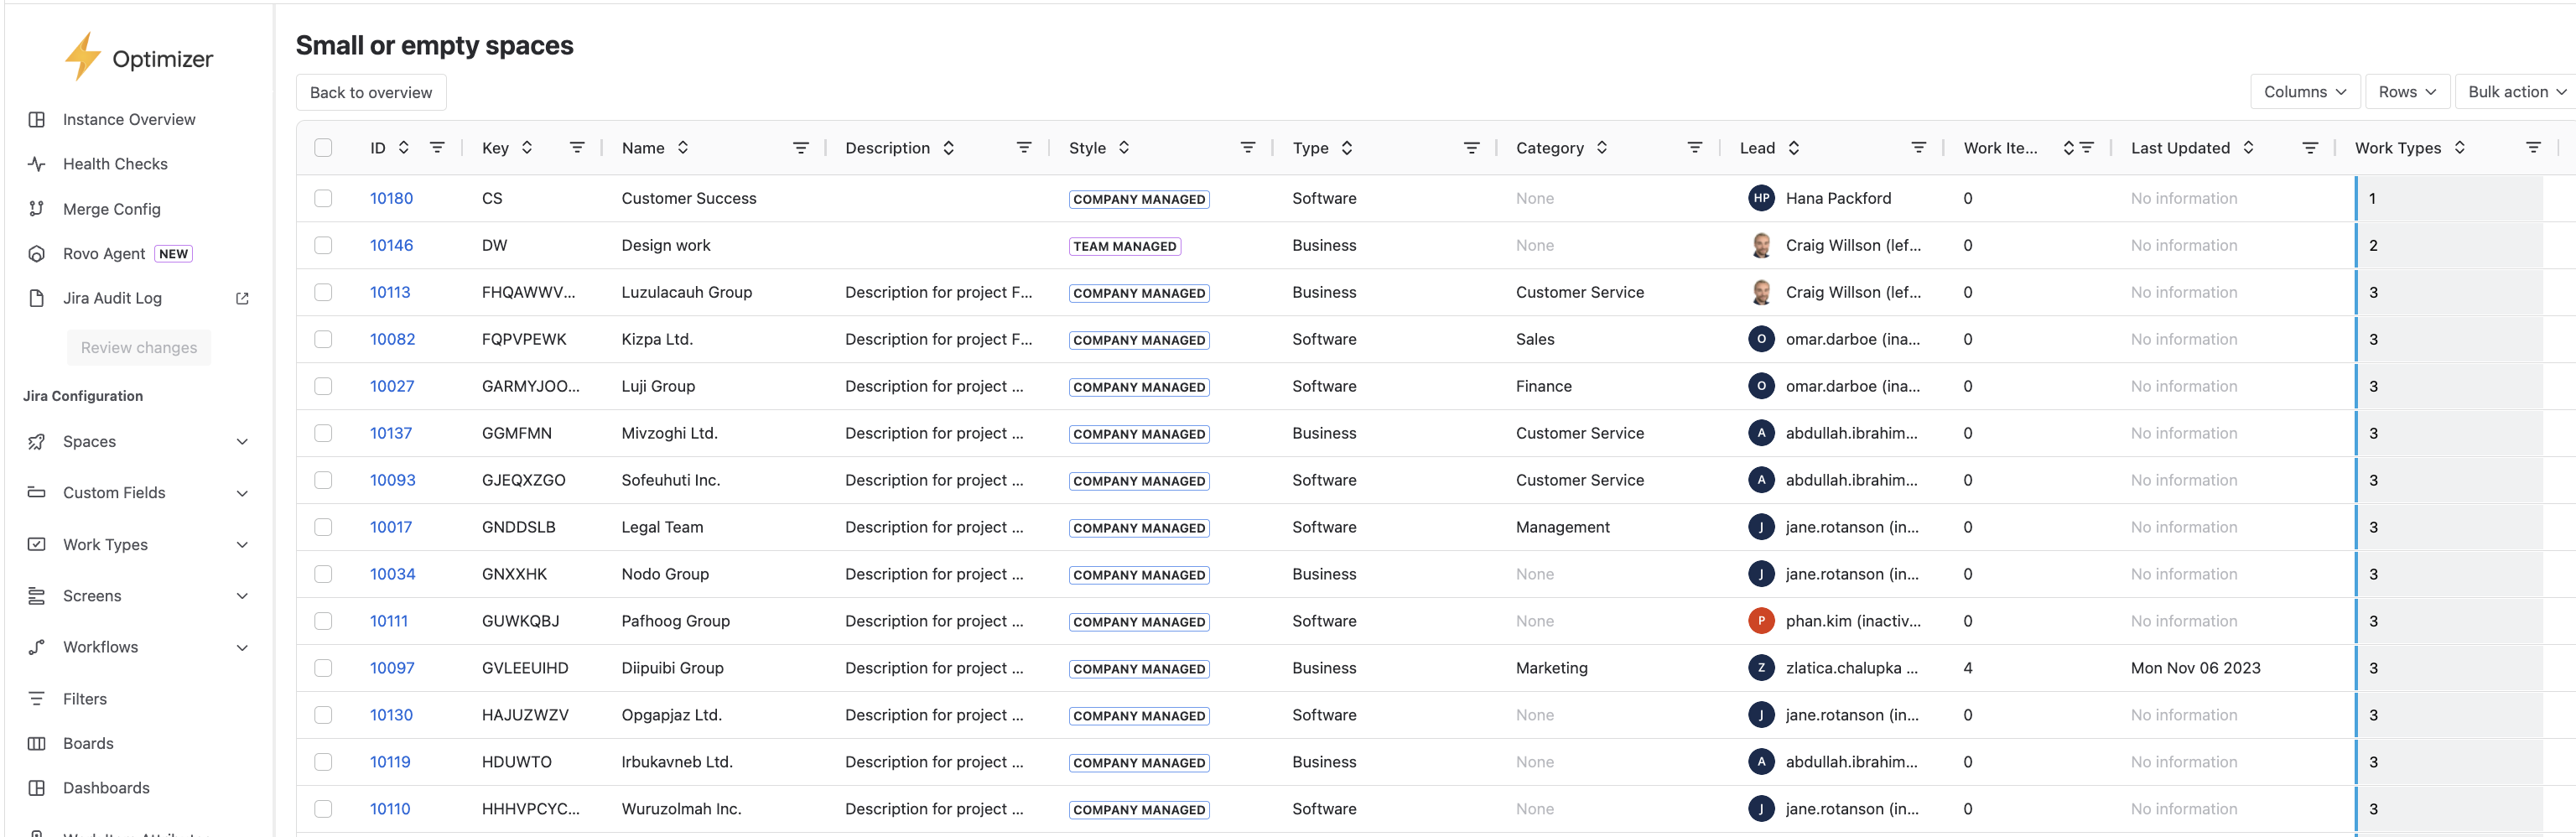
From the Smart Tables, you can take actions such as bulk archiving inactive projects and updating Project Leads.
Your Health Score and Goals
On the right‑hand side of the Health Checks page you can see:
-
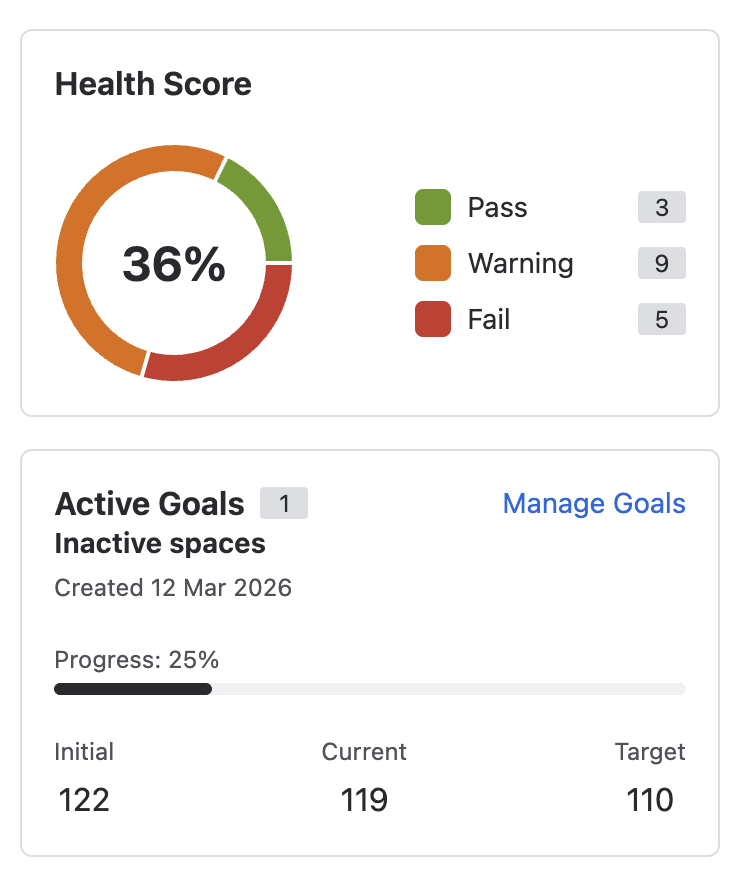
Health Score: a donut chart showing an overall health score of your instance as a percentage and how many checks are currently Pass, Warning, or Fail.
-
Active Goals: a summary of any optimisation goals you have configured, including current progress, initial value, current value, and target. Click on ‘Manage Goals’ in the top right to create, view and adjust these. You can find out more about Goals here.
Use these panels to understand at a glance how healthy your Jira configuration is and how your improvement work is progressing.
Customise your Health Checks
All of Optimizer’s health checks can be customised. For example, for checks that detect duplicate items, you can specify whether you want to search for exact duplicates or include items that nearly match but are slightly different.
To customise a health check, click the settings (cog) icon in the Actions column for the health check you want to customise (marked out in orange below).
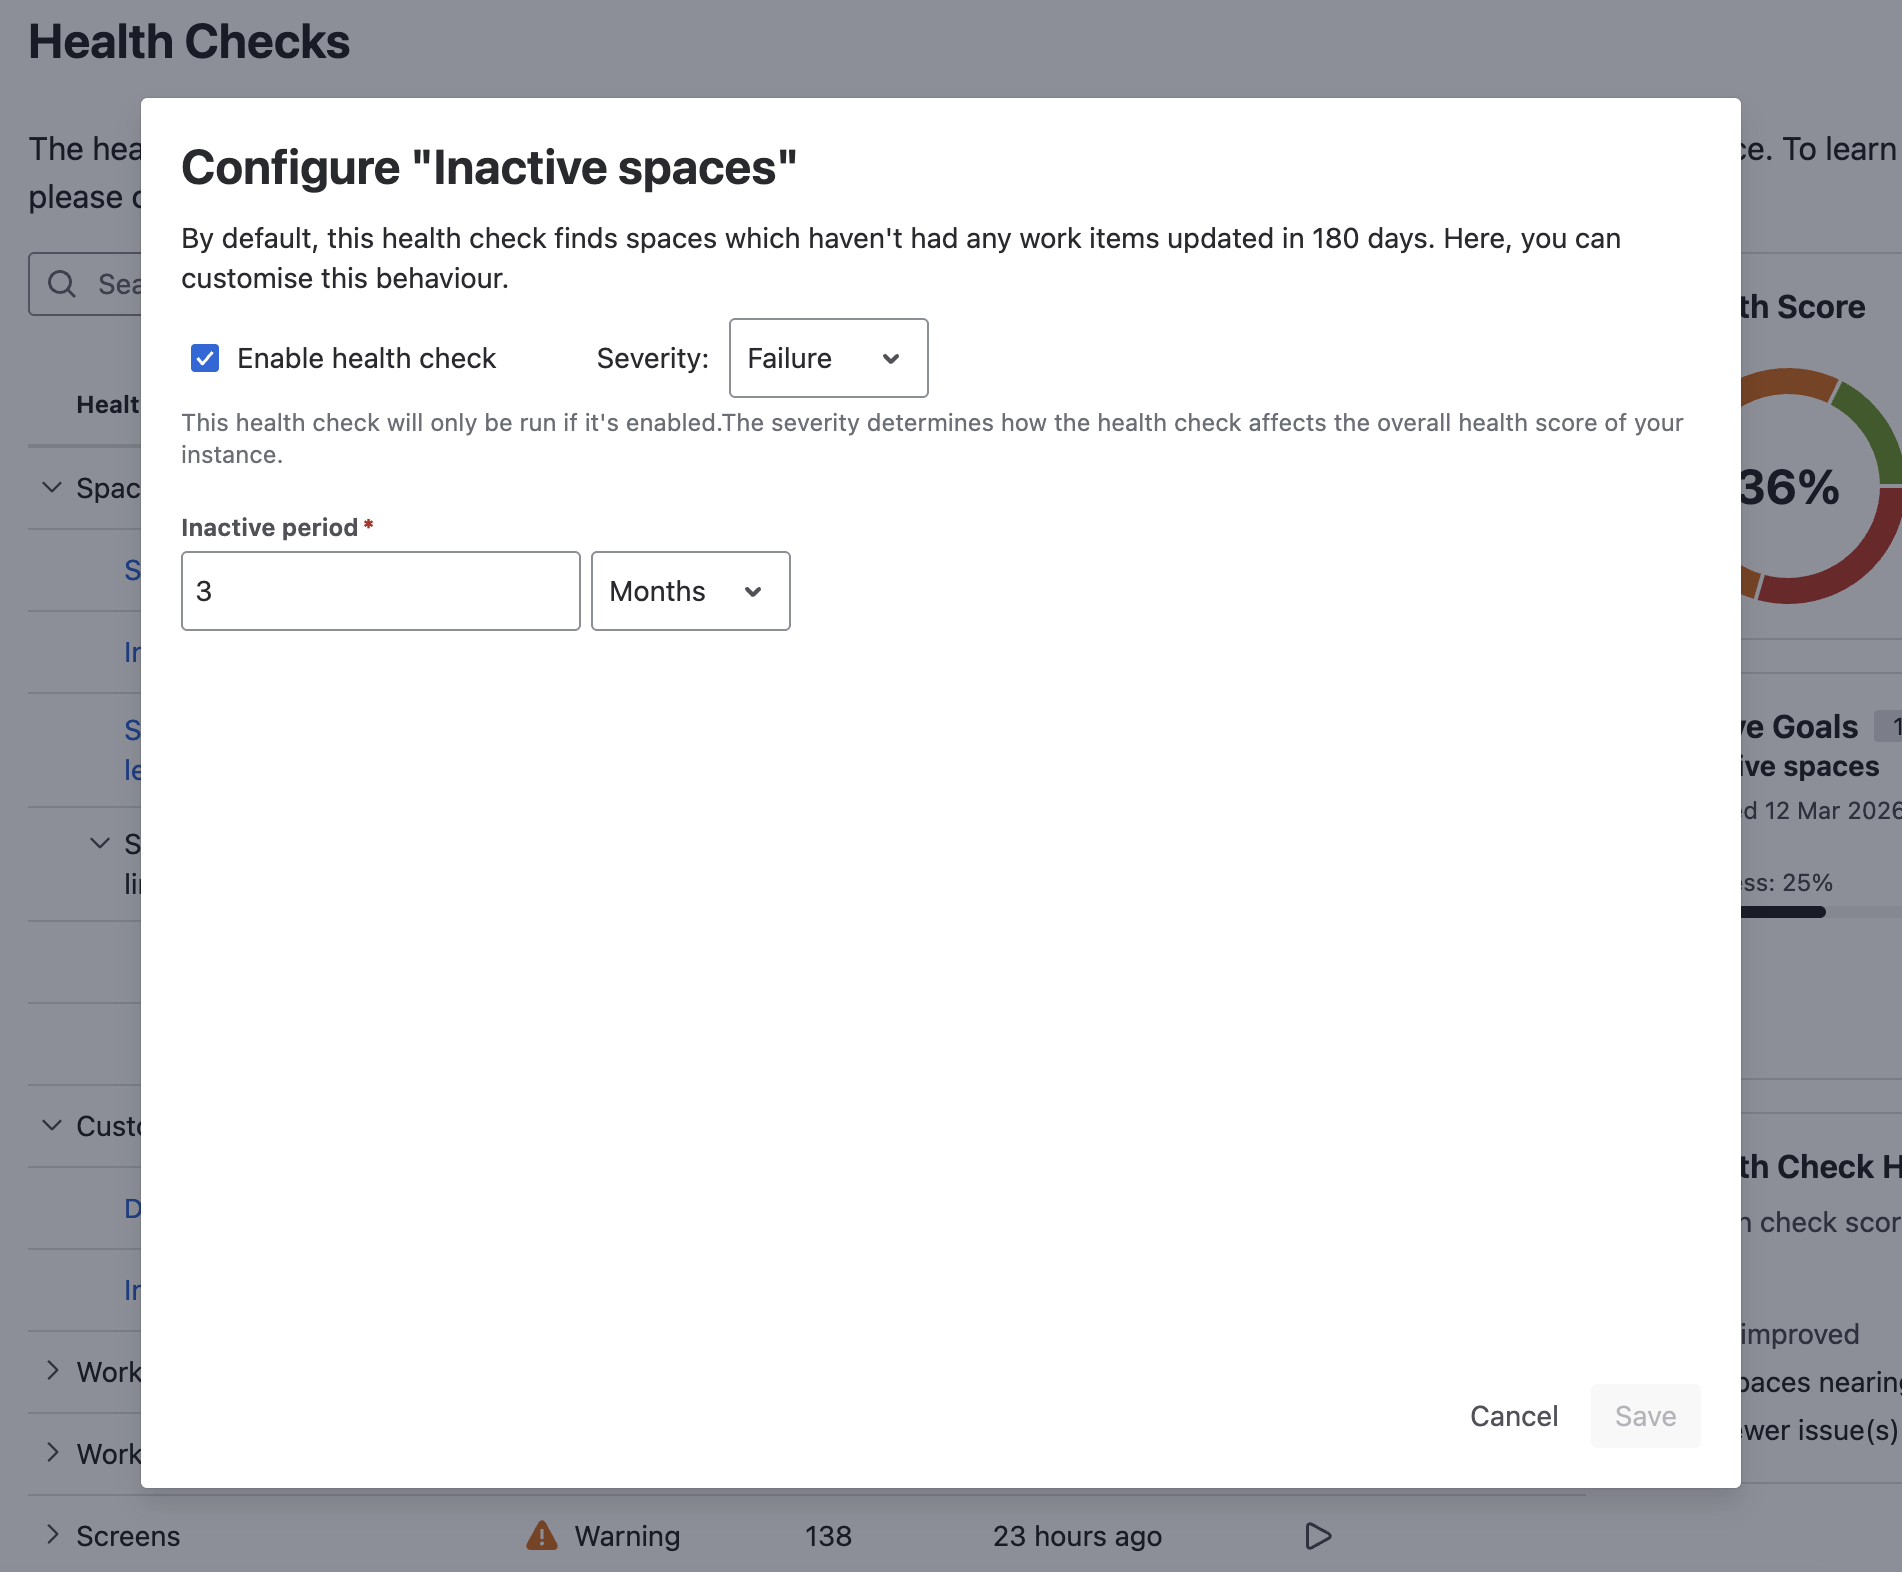
A settings panel will then appear to allow you to adjust the configurations for that health check. For example, for ‘inactive spaces’ as you can see in the screenshot below, you can configure what can be defined as an ‘inactive period’ so that it is very specific to your organisation.
You can disable or re-enable a health check by selecting the Enable health check checkbox in this settings panel.
You can also customise how each health check affects the health score for your instance by change its severity, by selecting the desired option from the Severity dropdown in the settings panel. Choose from ‘Failure’ or ‘Warning’.
Preferences for each health check are shared across all users on your Jira instance. When you change a setting, it is applied for everyone so your organisation can maintain a consistent definition of what counts as a ‘problem’.
View your Health Check history
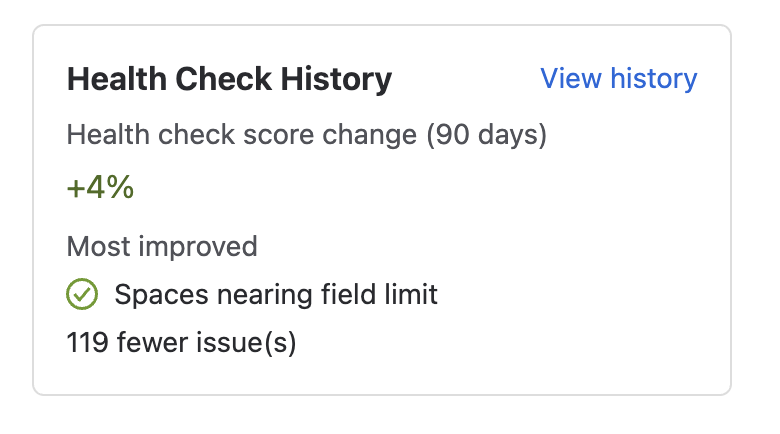
The Health Check History panel on the right‑hand side of the Health Checks page gives a quick summary of how your health score has changed over the past 90 days, including:
-
Overall score change (for example, +4%).
-
The most improved check and how many fewer issues were found.
To explore history in more detail, click View history. This opens the Health Checks - History page.
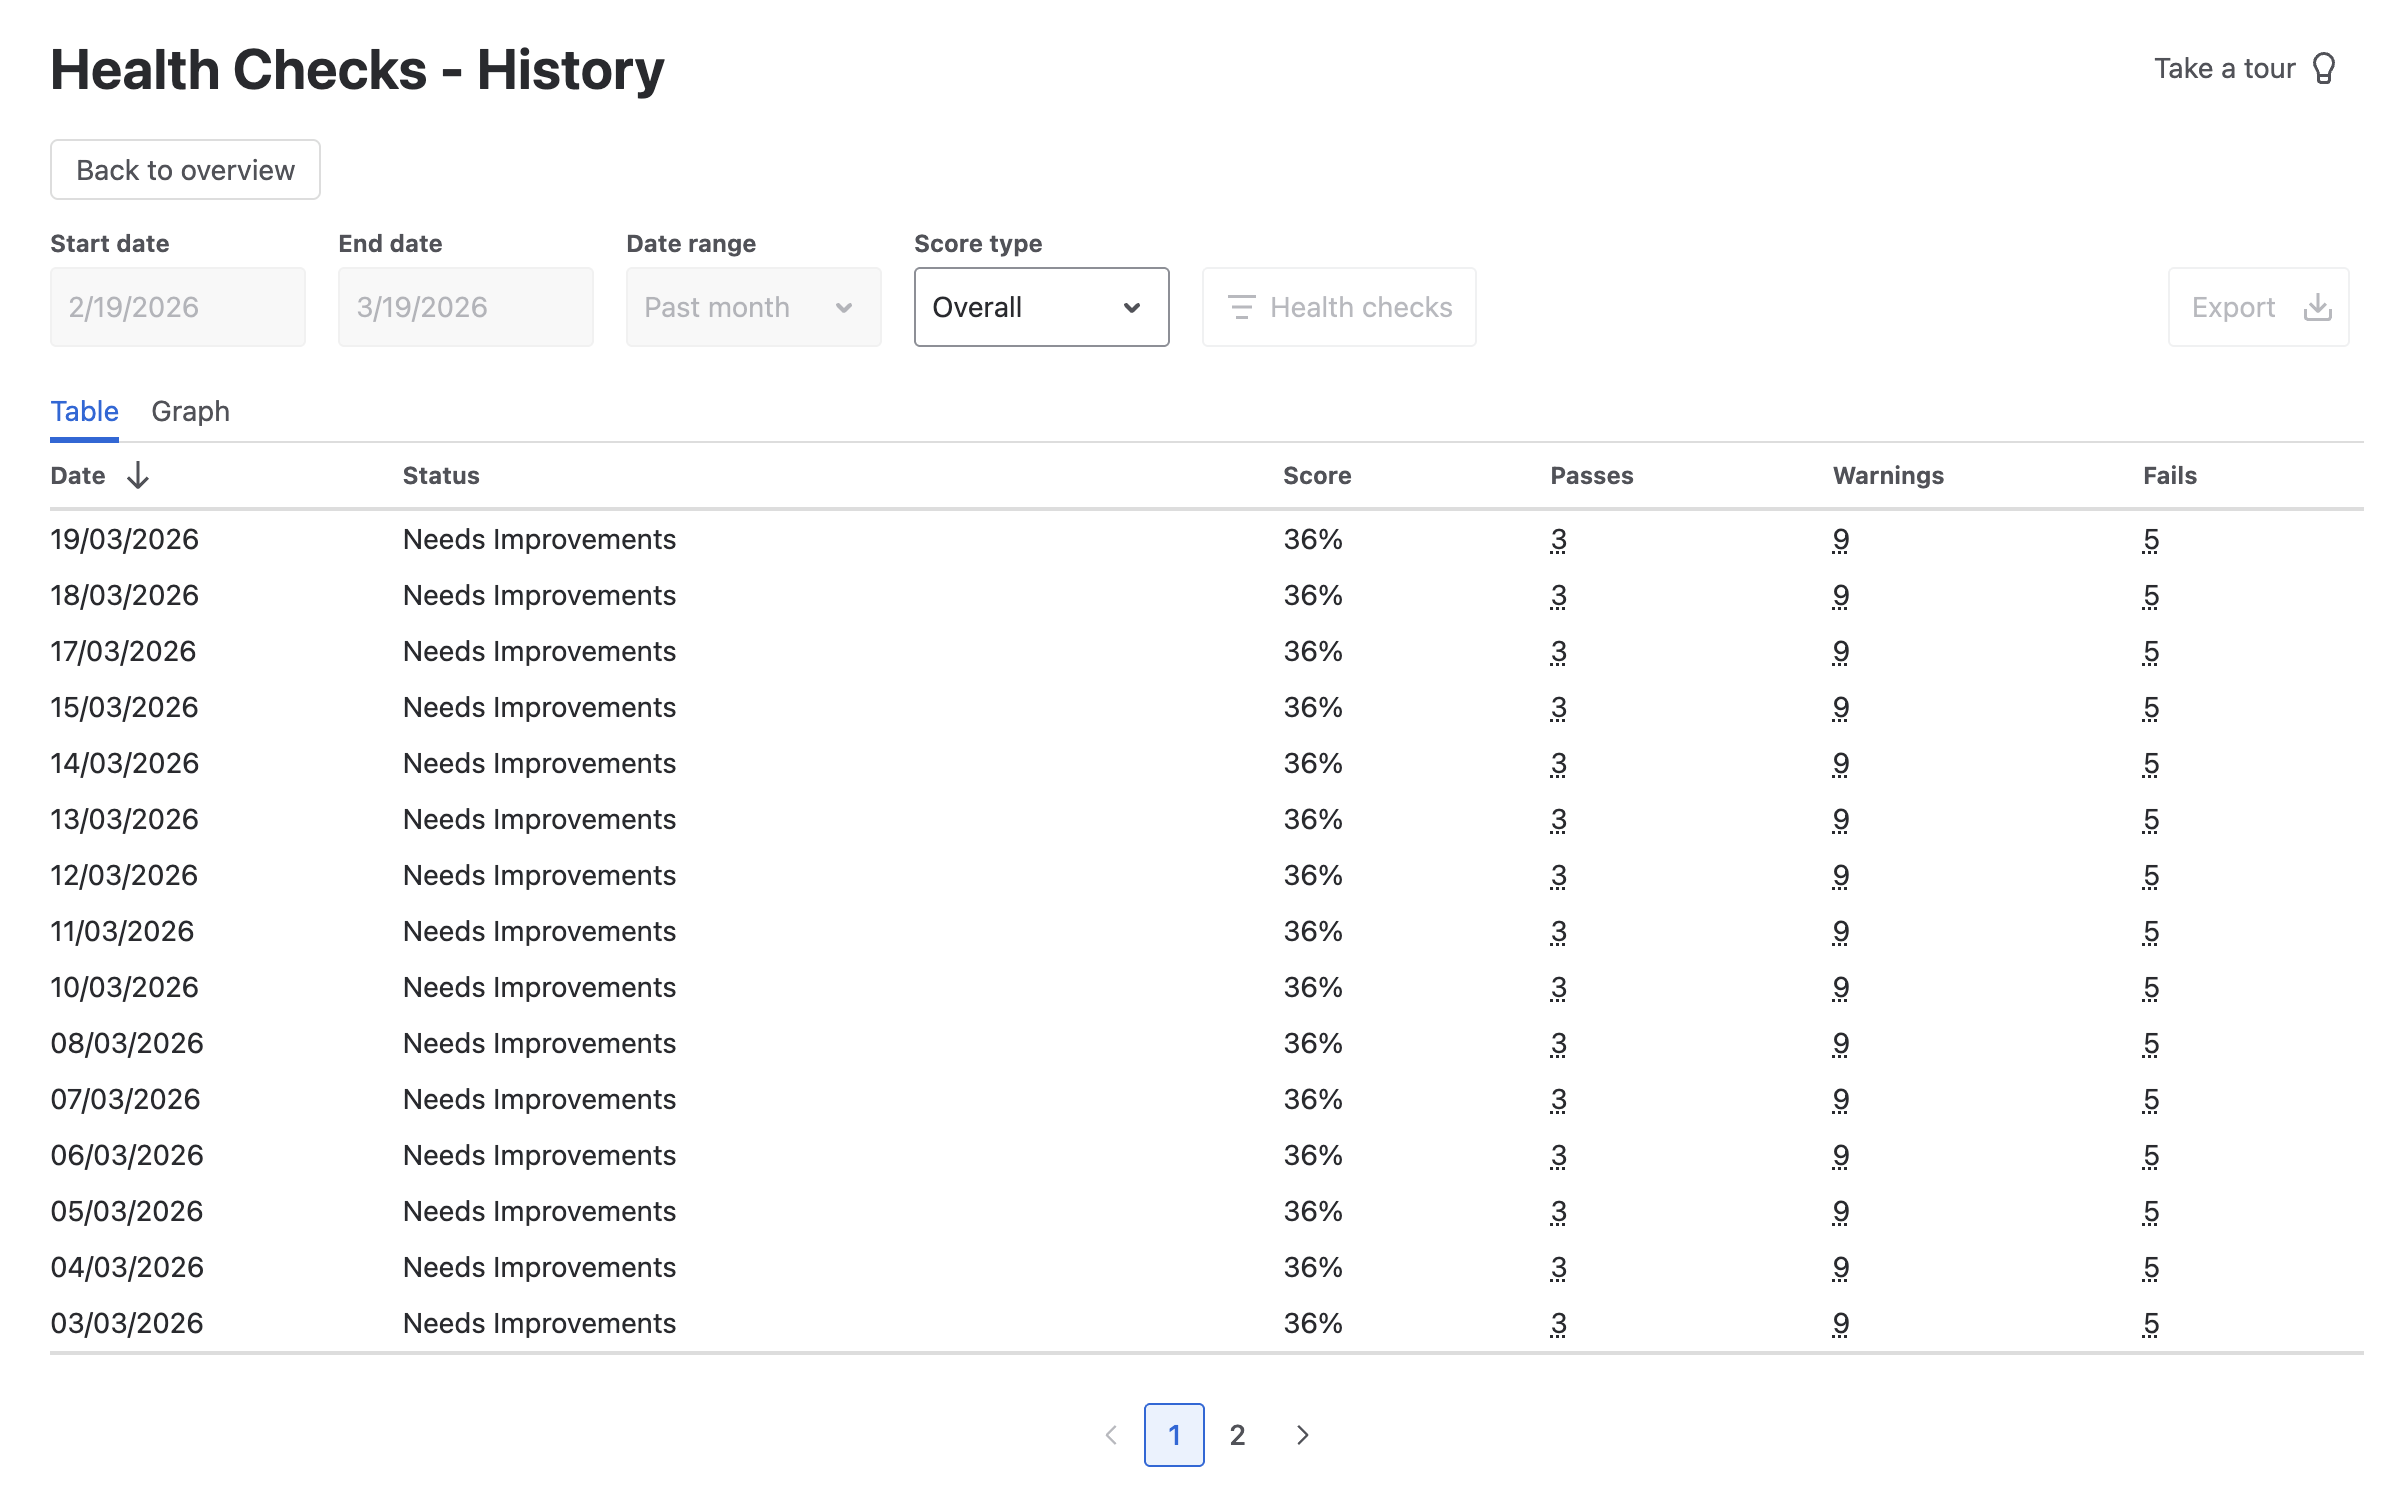
Here, you can review a table of daily health scores, including the date, overall status, percentage score, and the number of checks that passed, triggered warnings, or failed on each day.
You can adjust the period you want to review by setting a custom start and end date or by choosing a preset range such as the last 7 days, 30 days, or up to a year.
The Score type dropdown lets you toggle between an overall view, showing how your instance’s health score has changed over time, and an individual view, which breaks down the results for each health check. You can also filter the history to focus on specific checks.
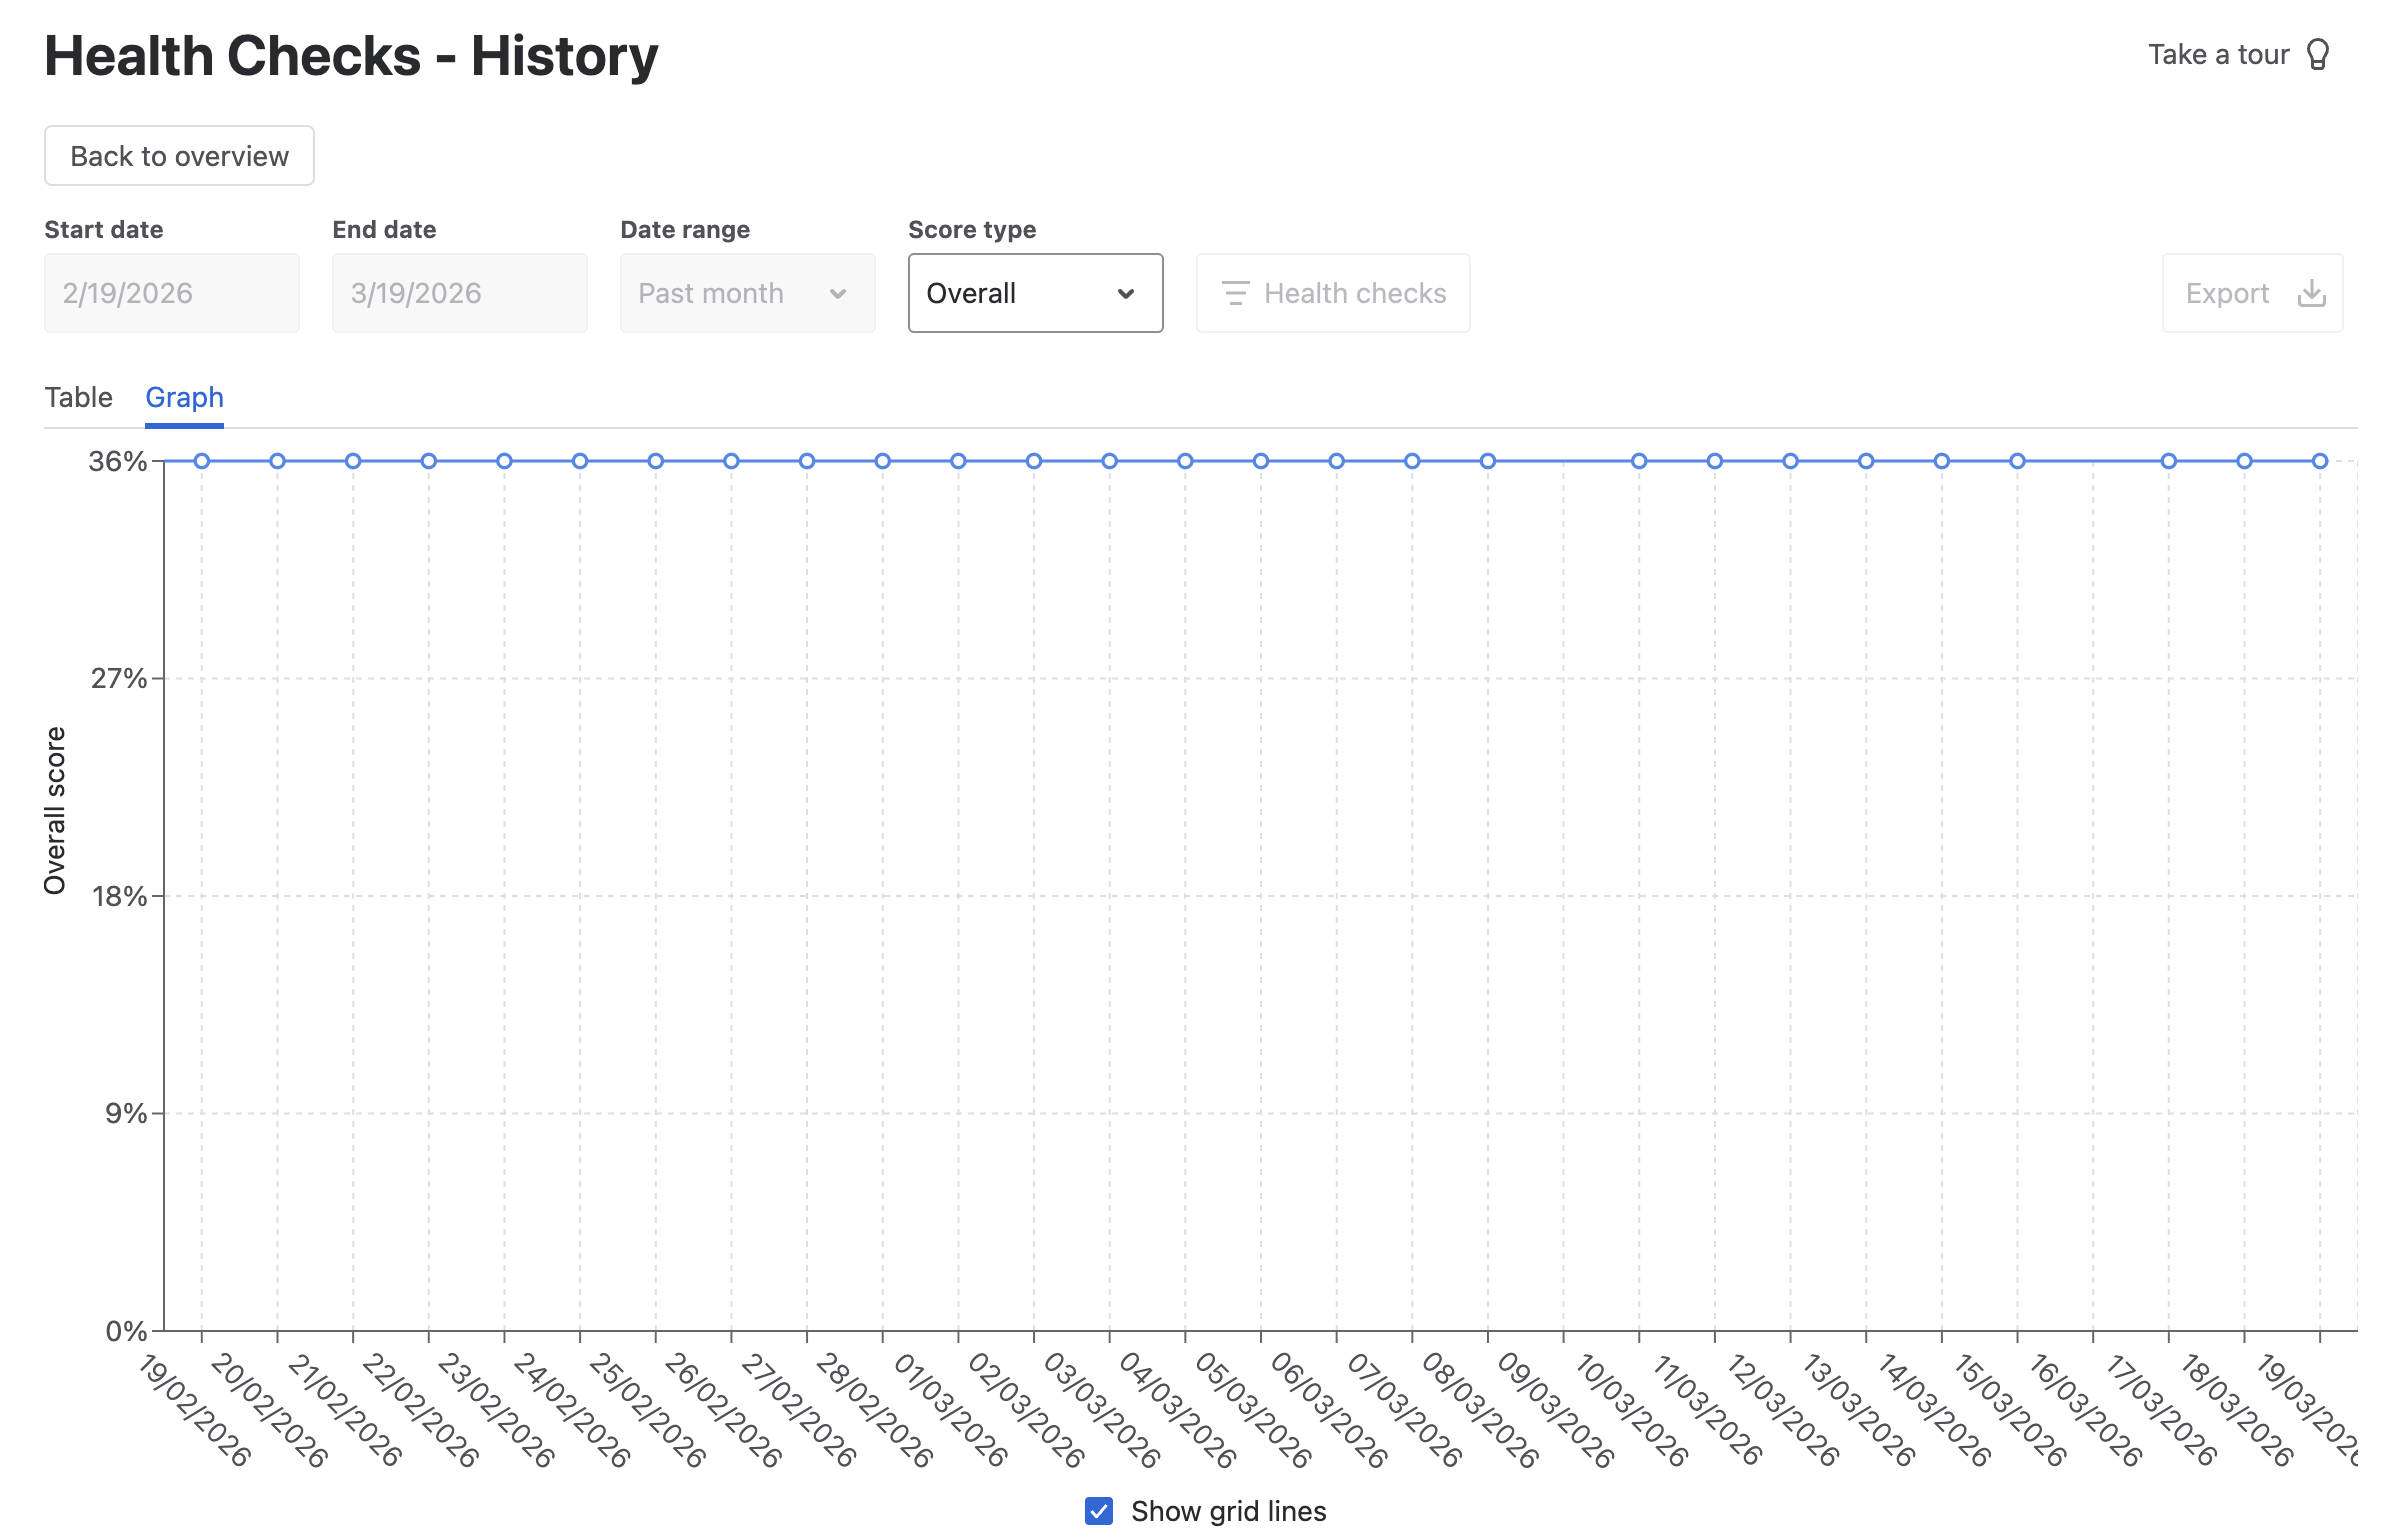
You can switch between a table or graph view using the tabs at the top.
If you need to analyse trends or create your own reports, you can export the data as a CSV or PDF file using the Export button (available in the Advanced edition) in the bottom right-hand corner of the page.
Standard edition users can view up to one month of history but cannot export data; upgrading to the Advanced edition unlocks unlimited history and export options.
Need support? We’re here to help 🧡
If you have any questions about Optimizer or would like to speak with us, please don’t hesitate to contact our Customer Support team.