-20250819-084018.svg)
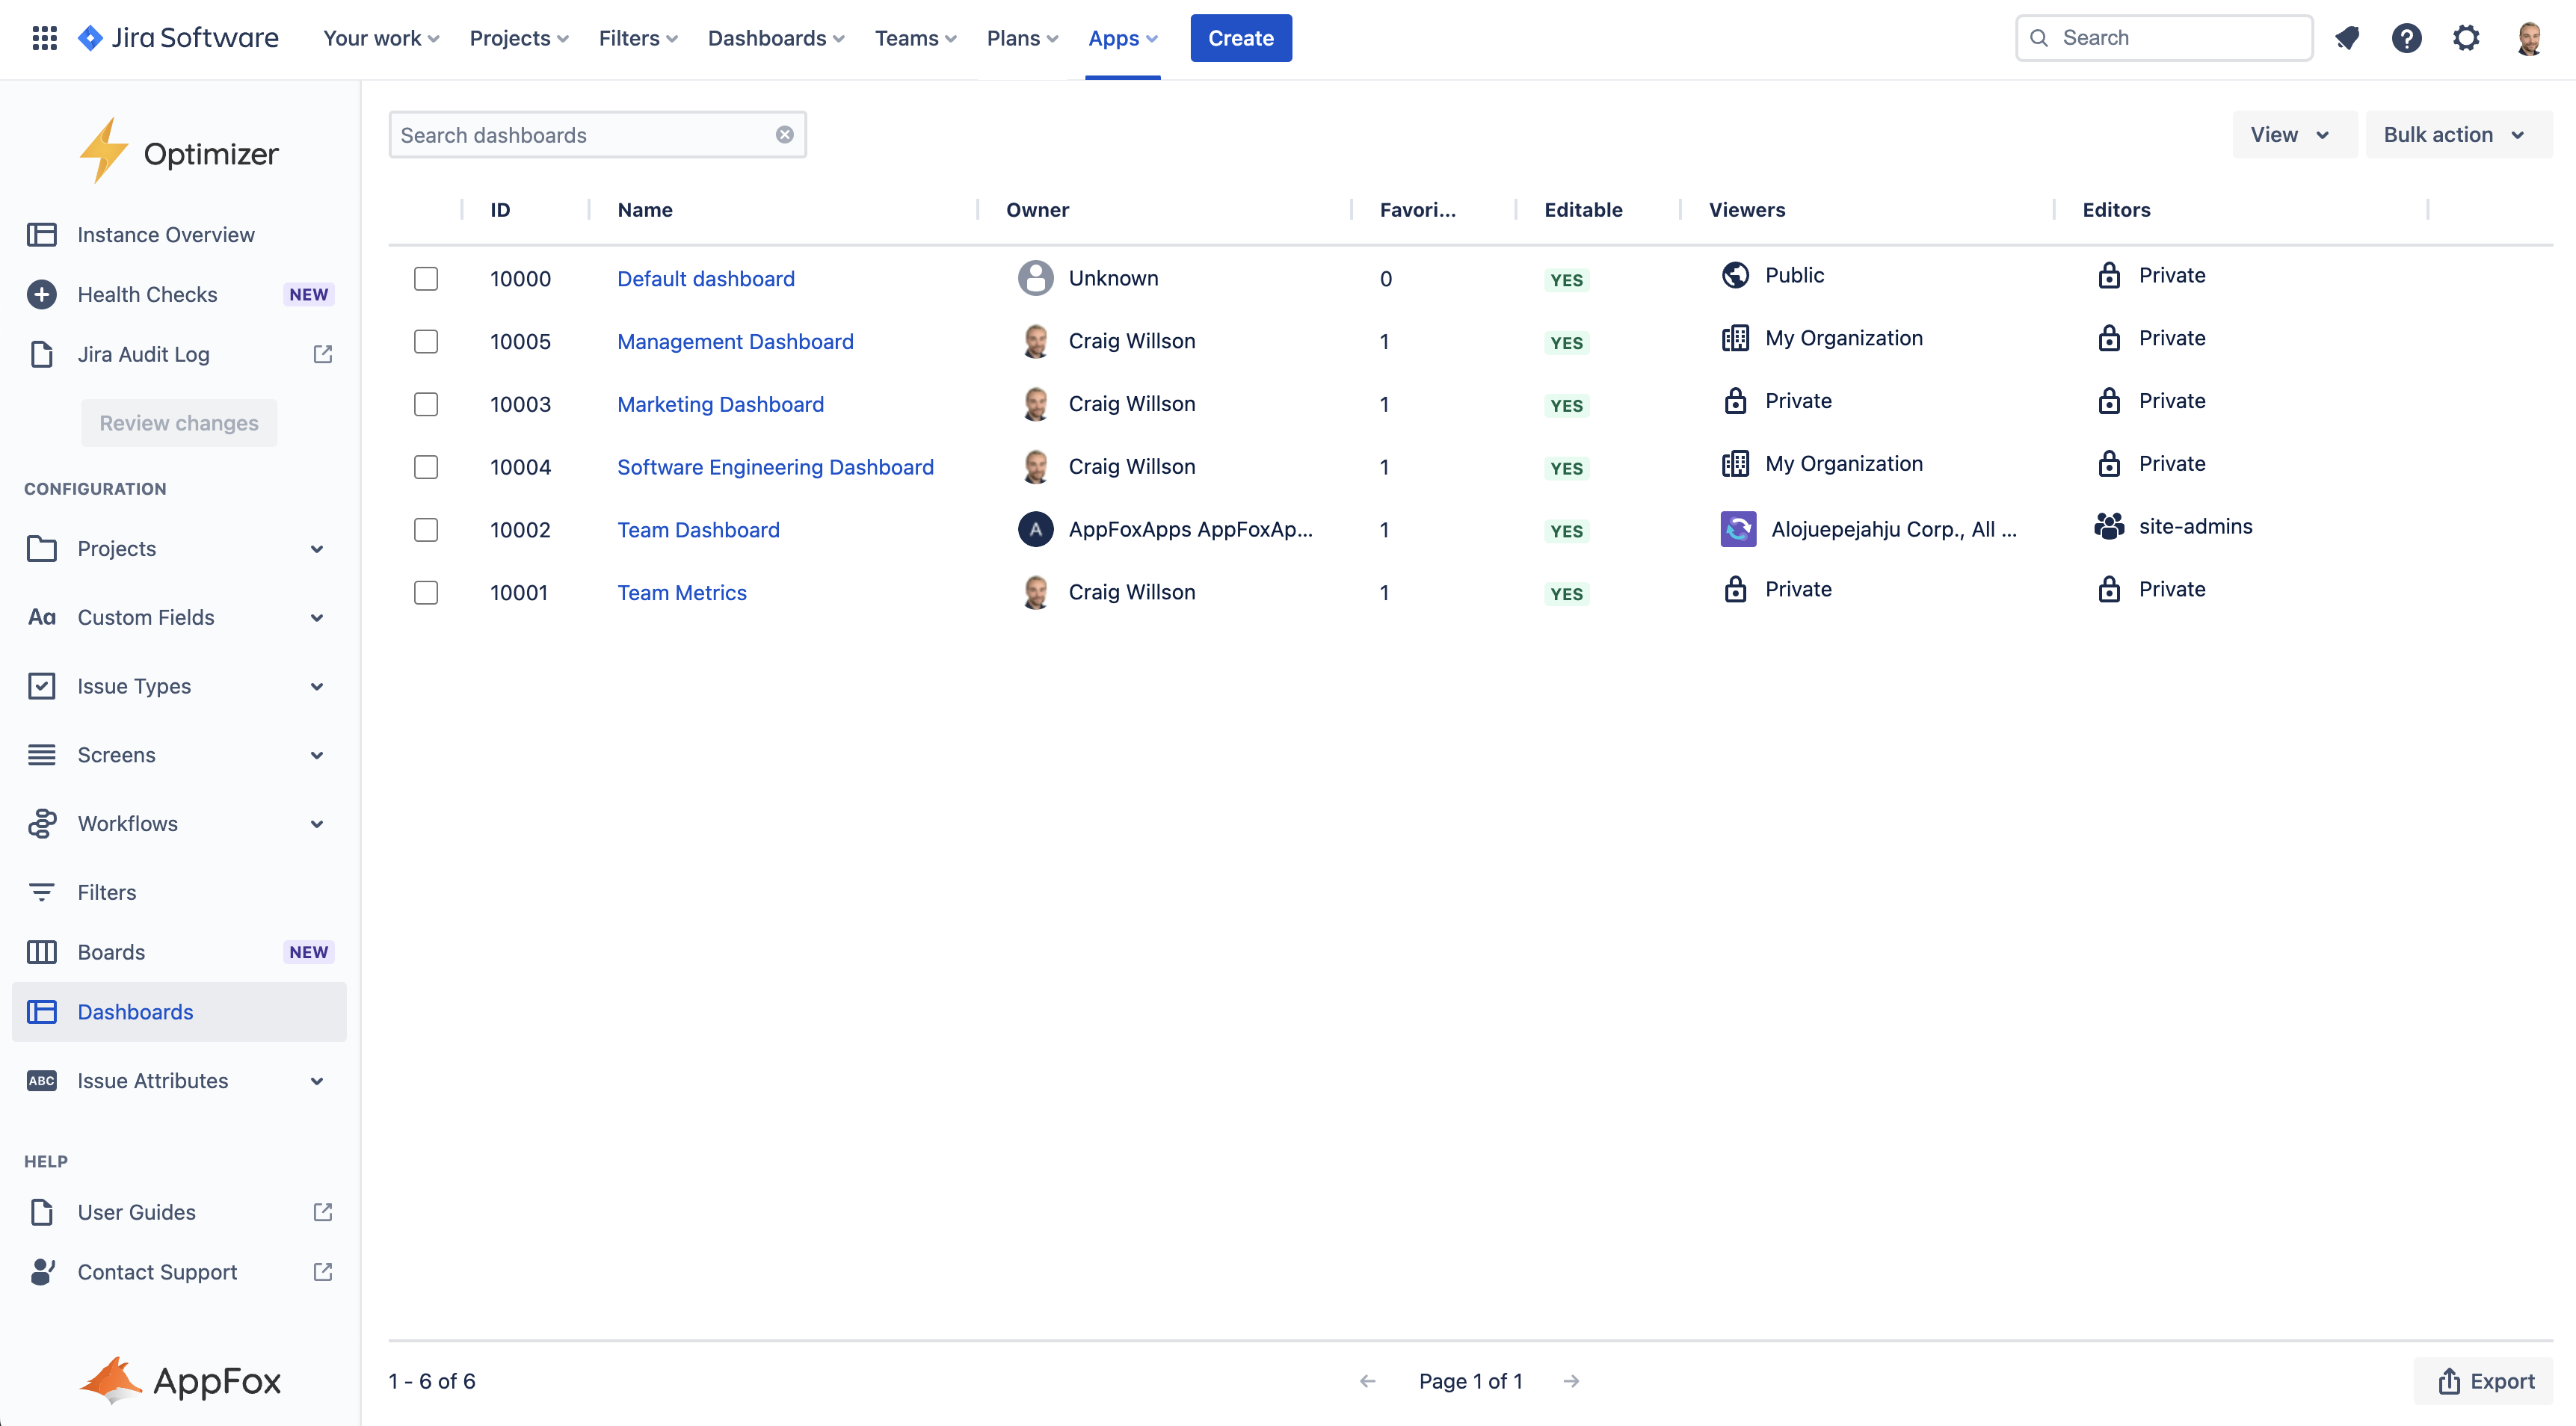
Dashboards are the foundation of reporting in Jira and teams of all sizes and types will use these to report on all the great work they are doing.
Over time, you may notice the number of dashboards has reached a high volume, and as part of your routine clean-up initiatives you may want to reduce the number. Optimizer’s Dashboards smart table will give you the perfect overview of all the dashboards in your Jira site and help you identify the areas for improvement.
Accessing the Dashboards table
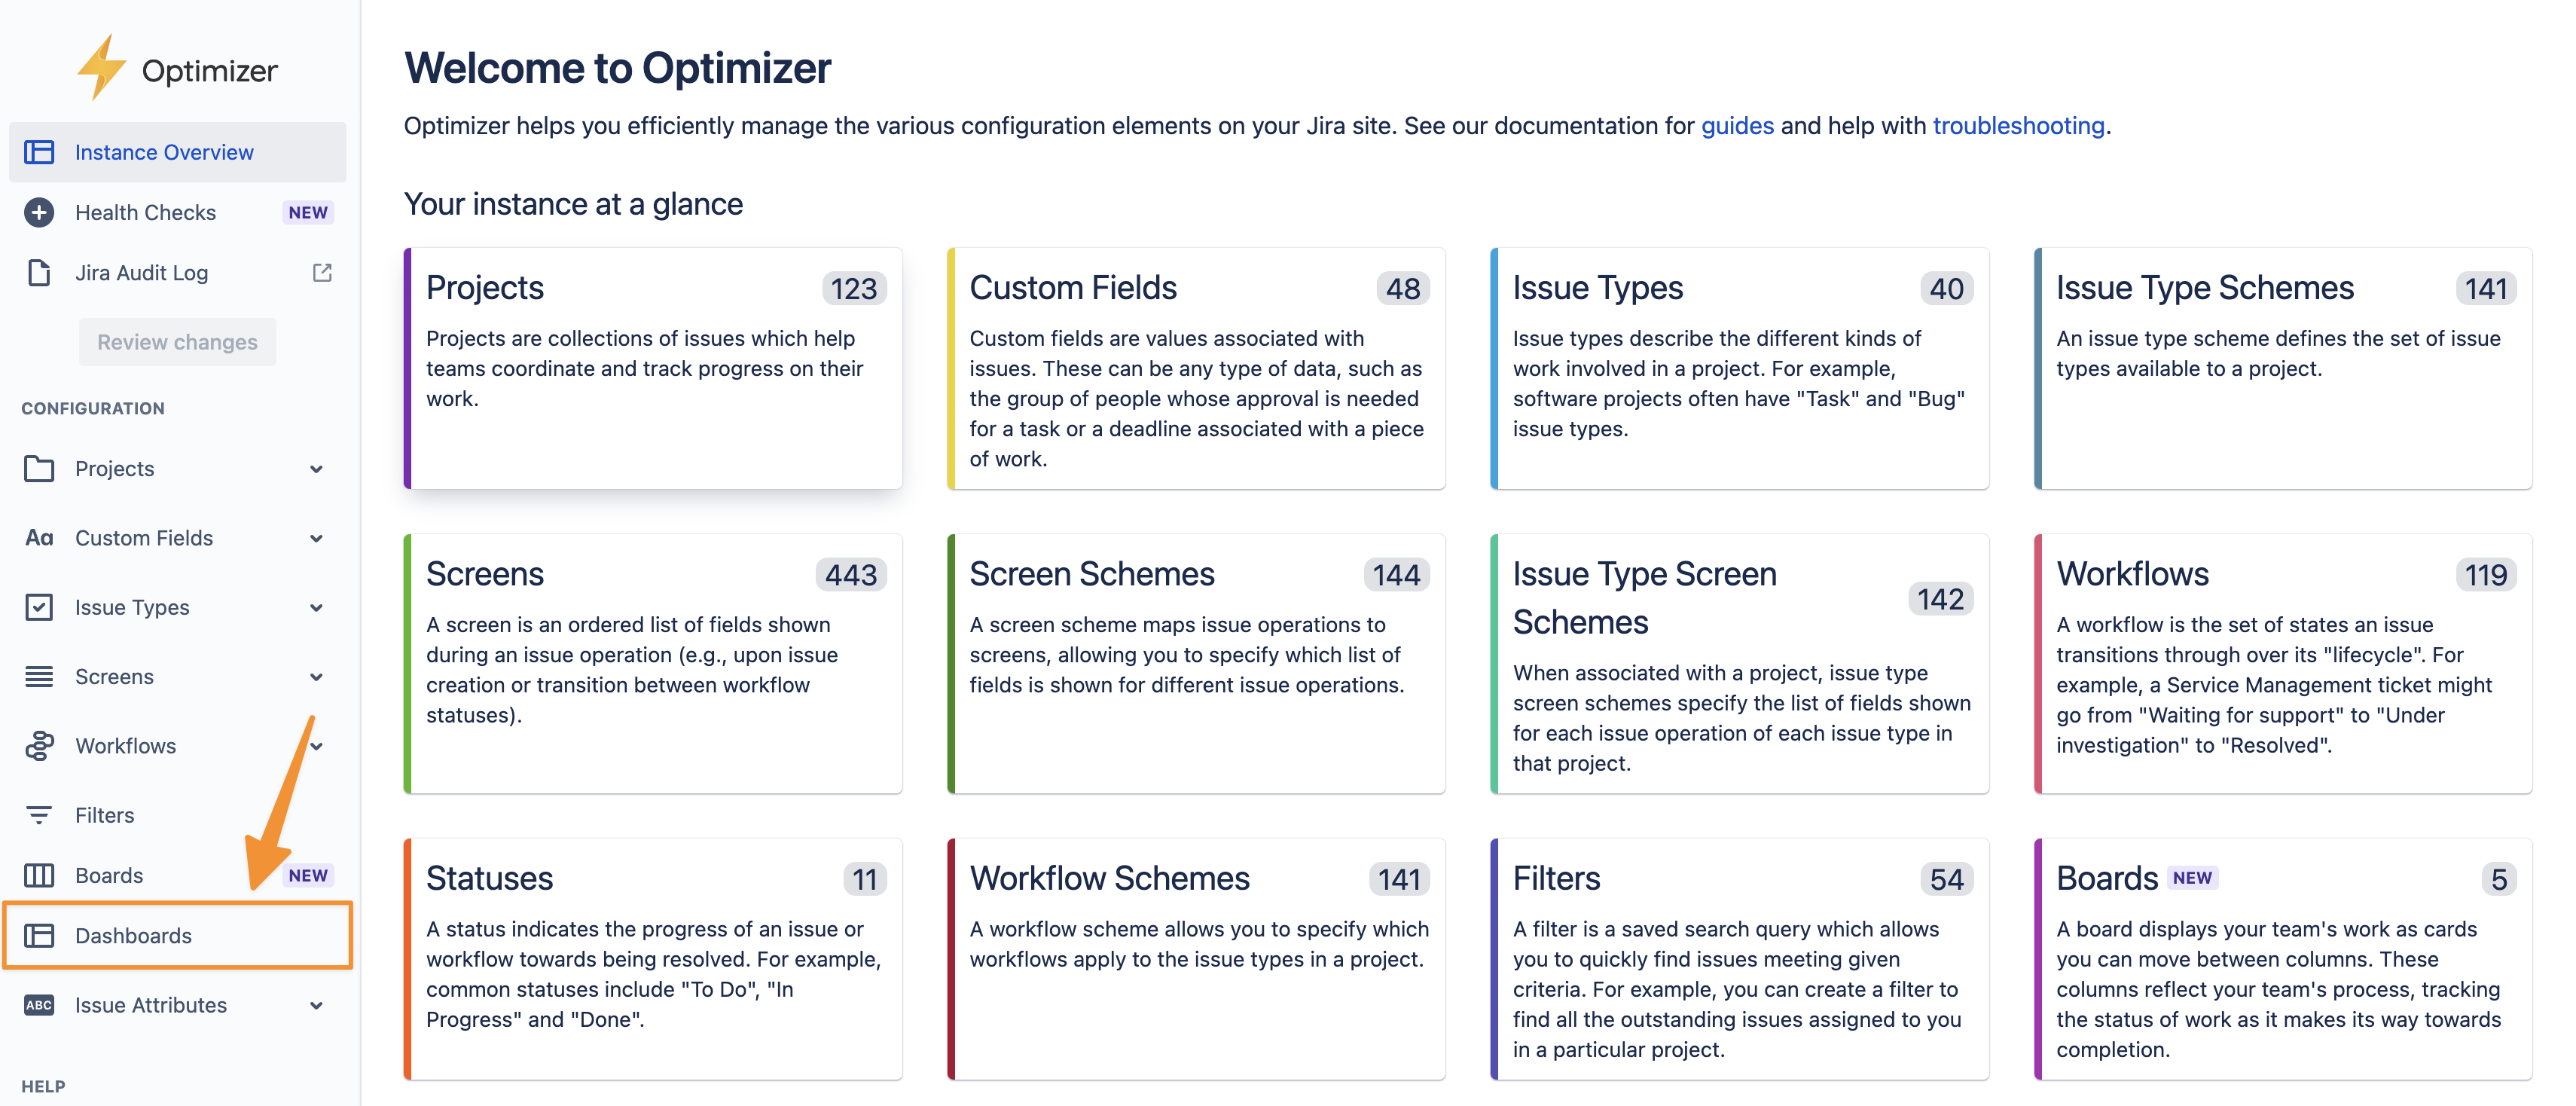
To access the Dashboards table, click Dashboards in the left-hand navigation menu in Optimizer, as shown in the image below.
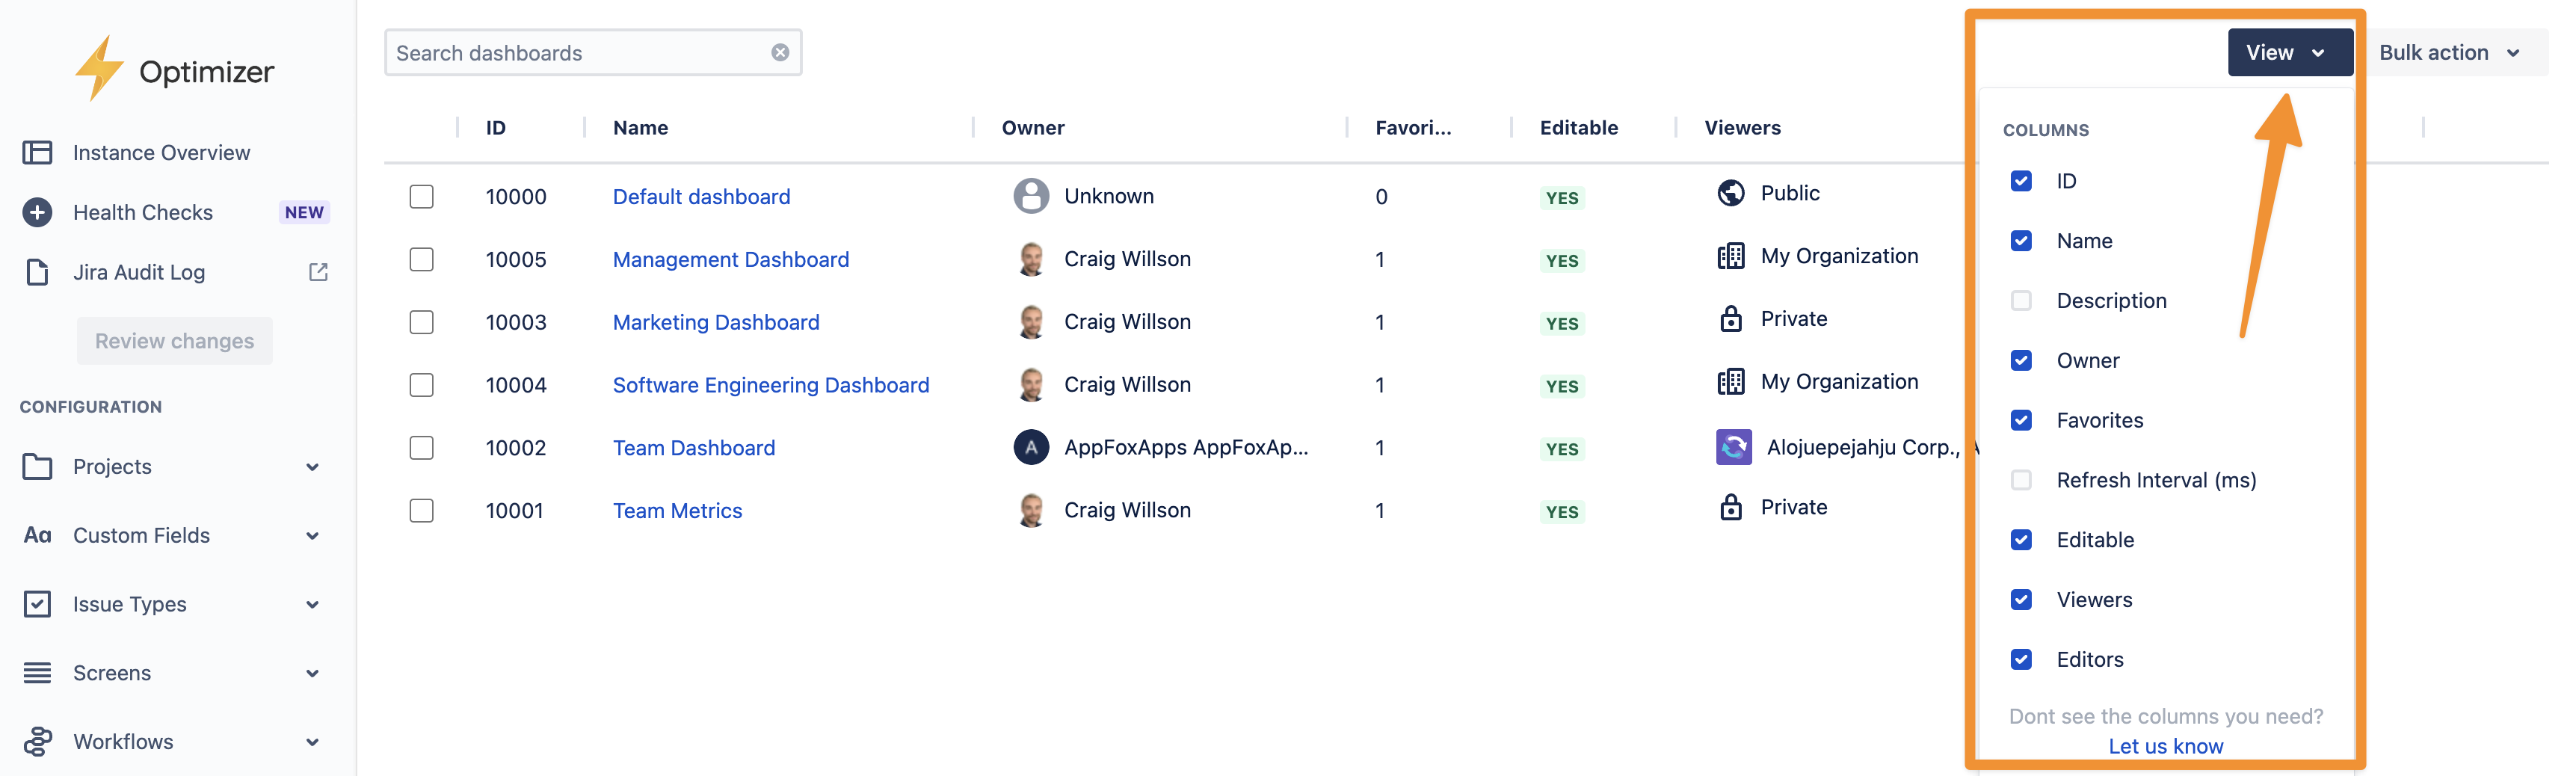
Columns Displayed
The following columns will be displayed in the Smart Table and you can easily add or remove columns using the View button displayed below.
Inline Editing
There are a number of columns that can be Inline Edited in the Dashboards table. The list below provides a full breakdown of which columns can be Inline Edited.
Inline editing is only available for dashboards you have permission to edit - this can be seen in the Editable column.
|
Column |
Inline editable? |
|---|---|
|
ID |
❌ |
|
Name |
✅ |
|
Description |
✅ |
|
Owner |
❌ |
|
Favorite count |
❌ |
|
Refresh interval |
❌ |
|
Editable |
❌ |
|
Viewer permissions |
❌ |
|
Editor permissions |
❌ |
For more information on Inline Editing in Optimizer for Jira, please refer to the Inline Editing User Guide.
Bulk actions
You can use the Permanently delete bulk action within the Dashboards smart table. Please exercise caution and take the time to review your changes before making them.
For more information on Bulk Actions in Optimizer for Jira, please refer to the Bulk Actions User Guide.
Need support? We’re here to help 🧡
If you have any questions about Optimizer or would like to speak with us, please don’t hesitate to reach out to our Customer Support team.