Reports
The reporting capability of Optimizer gives you an overview of many in-depth details about your Jira instance and the Optimizer’s usage.

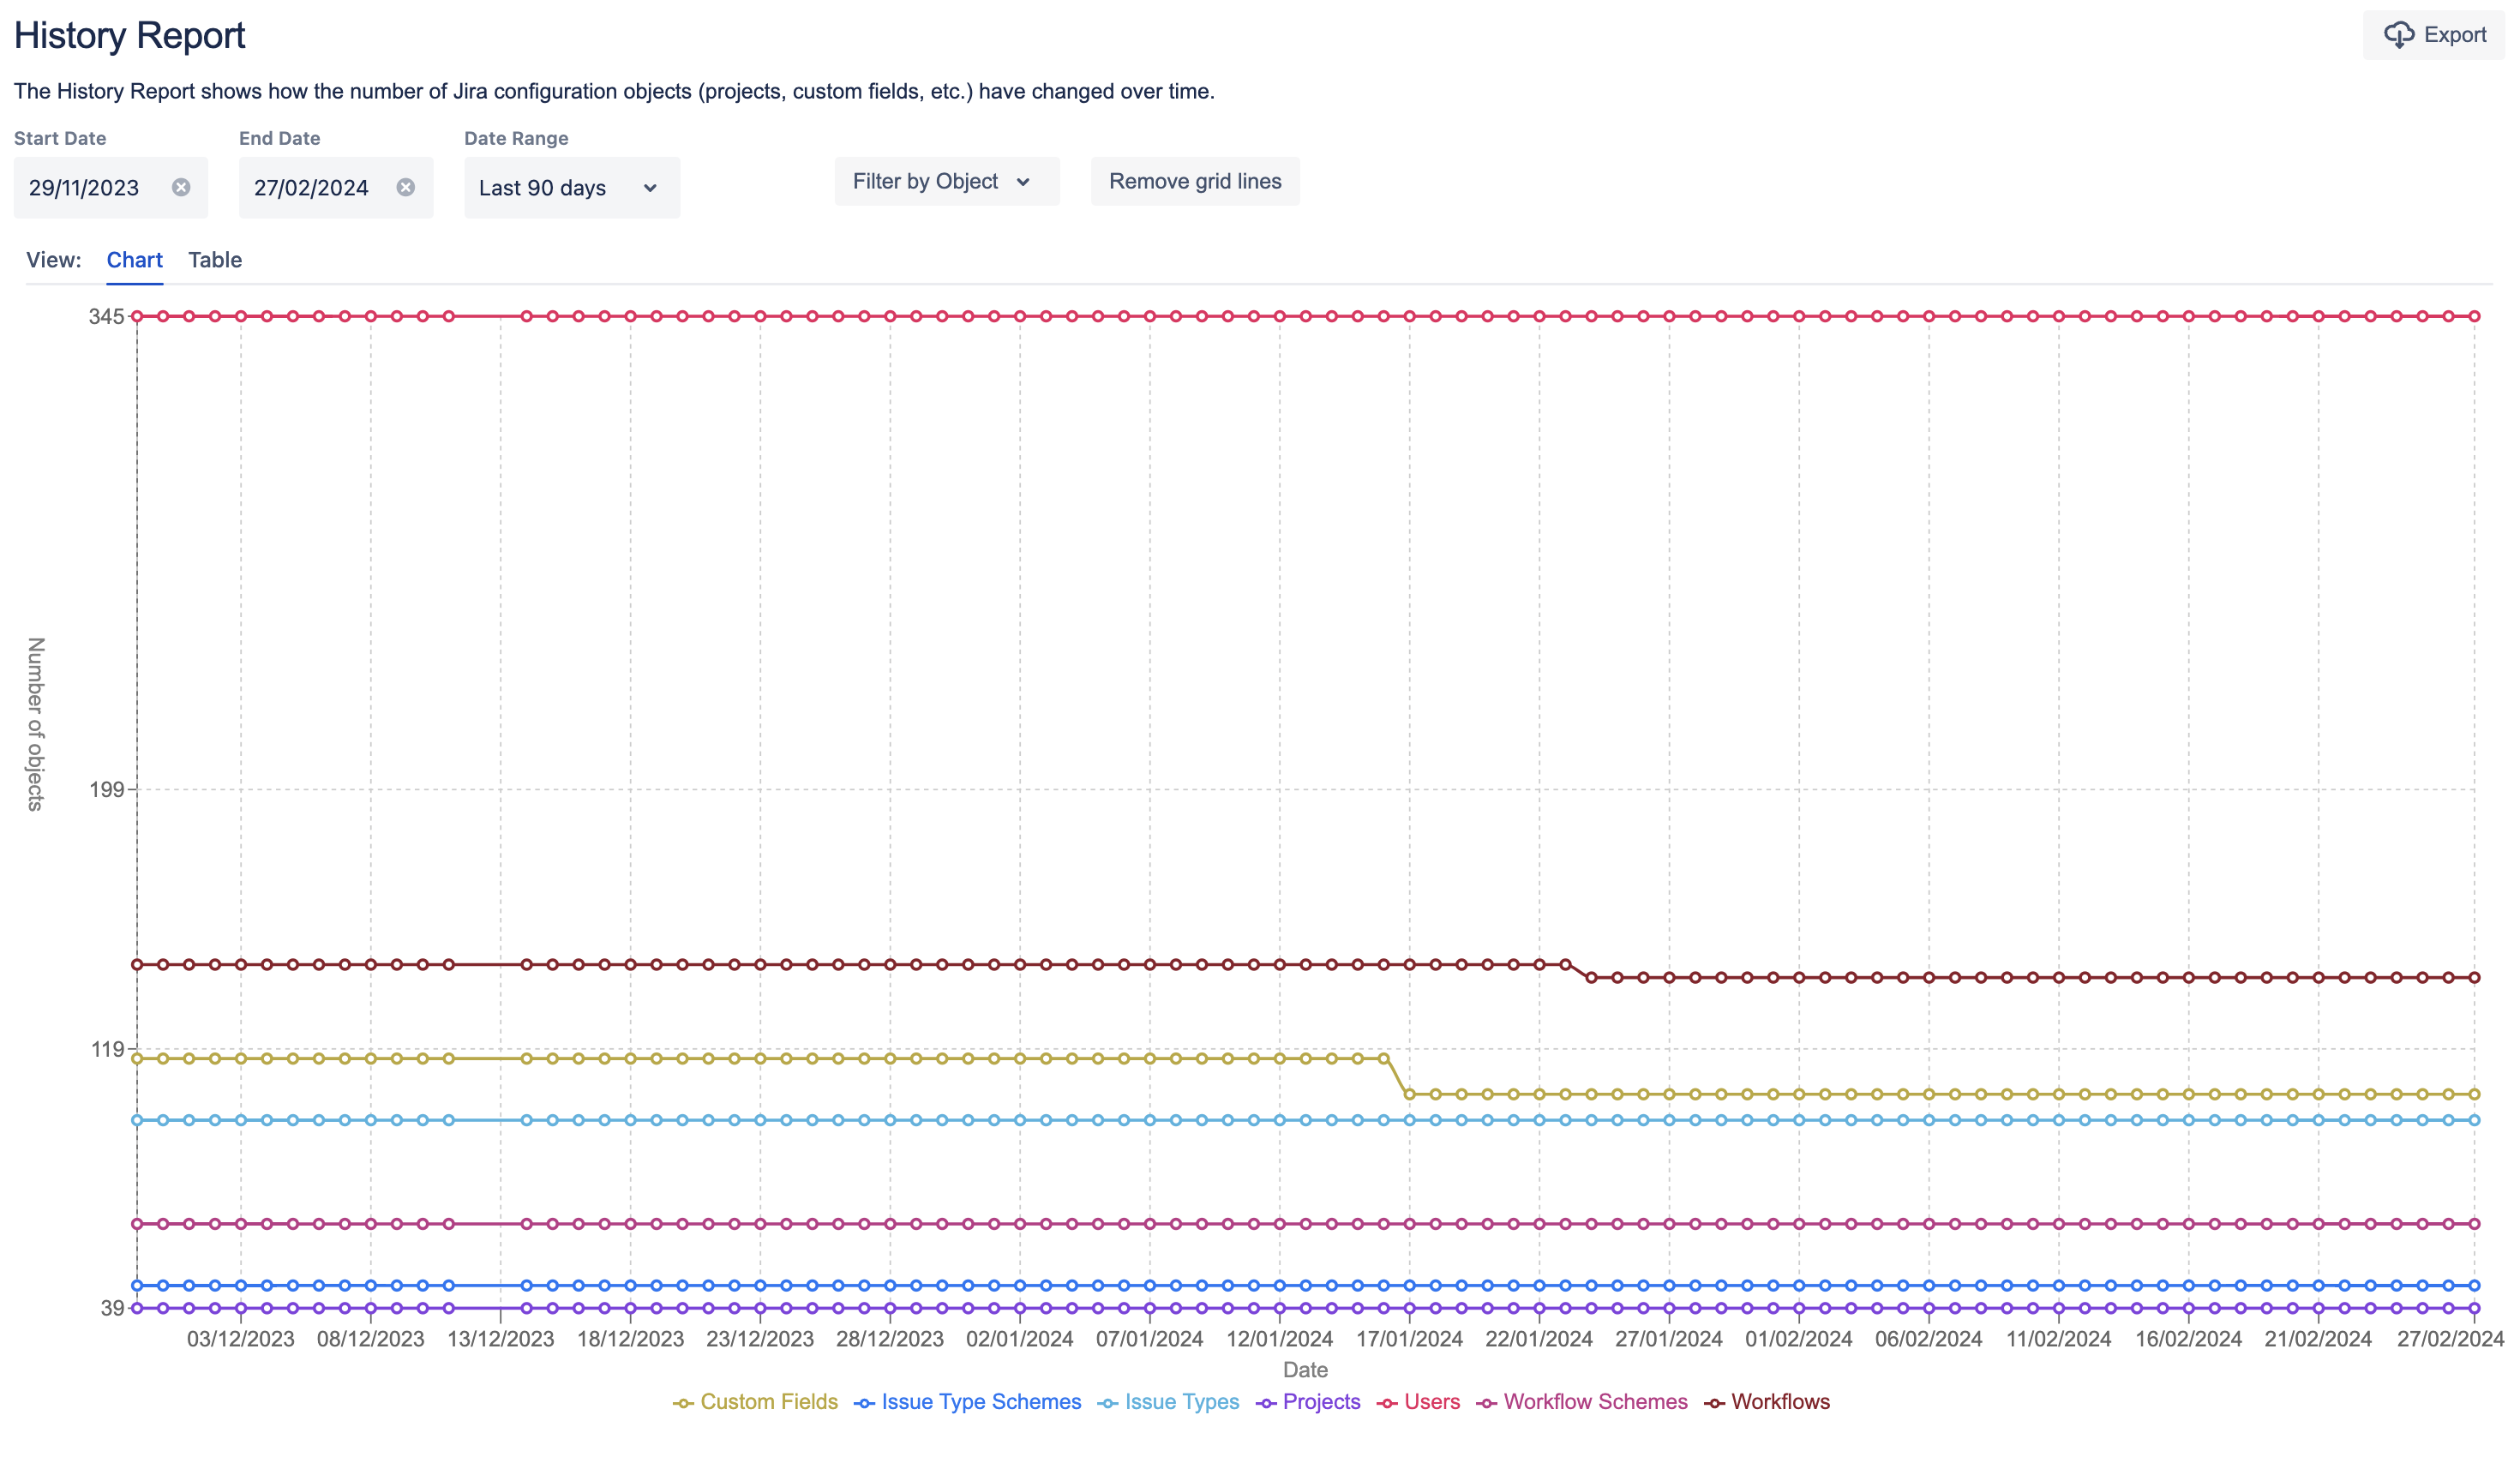
The History Report in Optimizer for Jira
There are a variety of reports available in Optimizer:
Accessing Reports
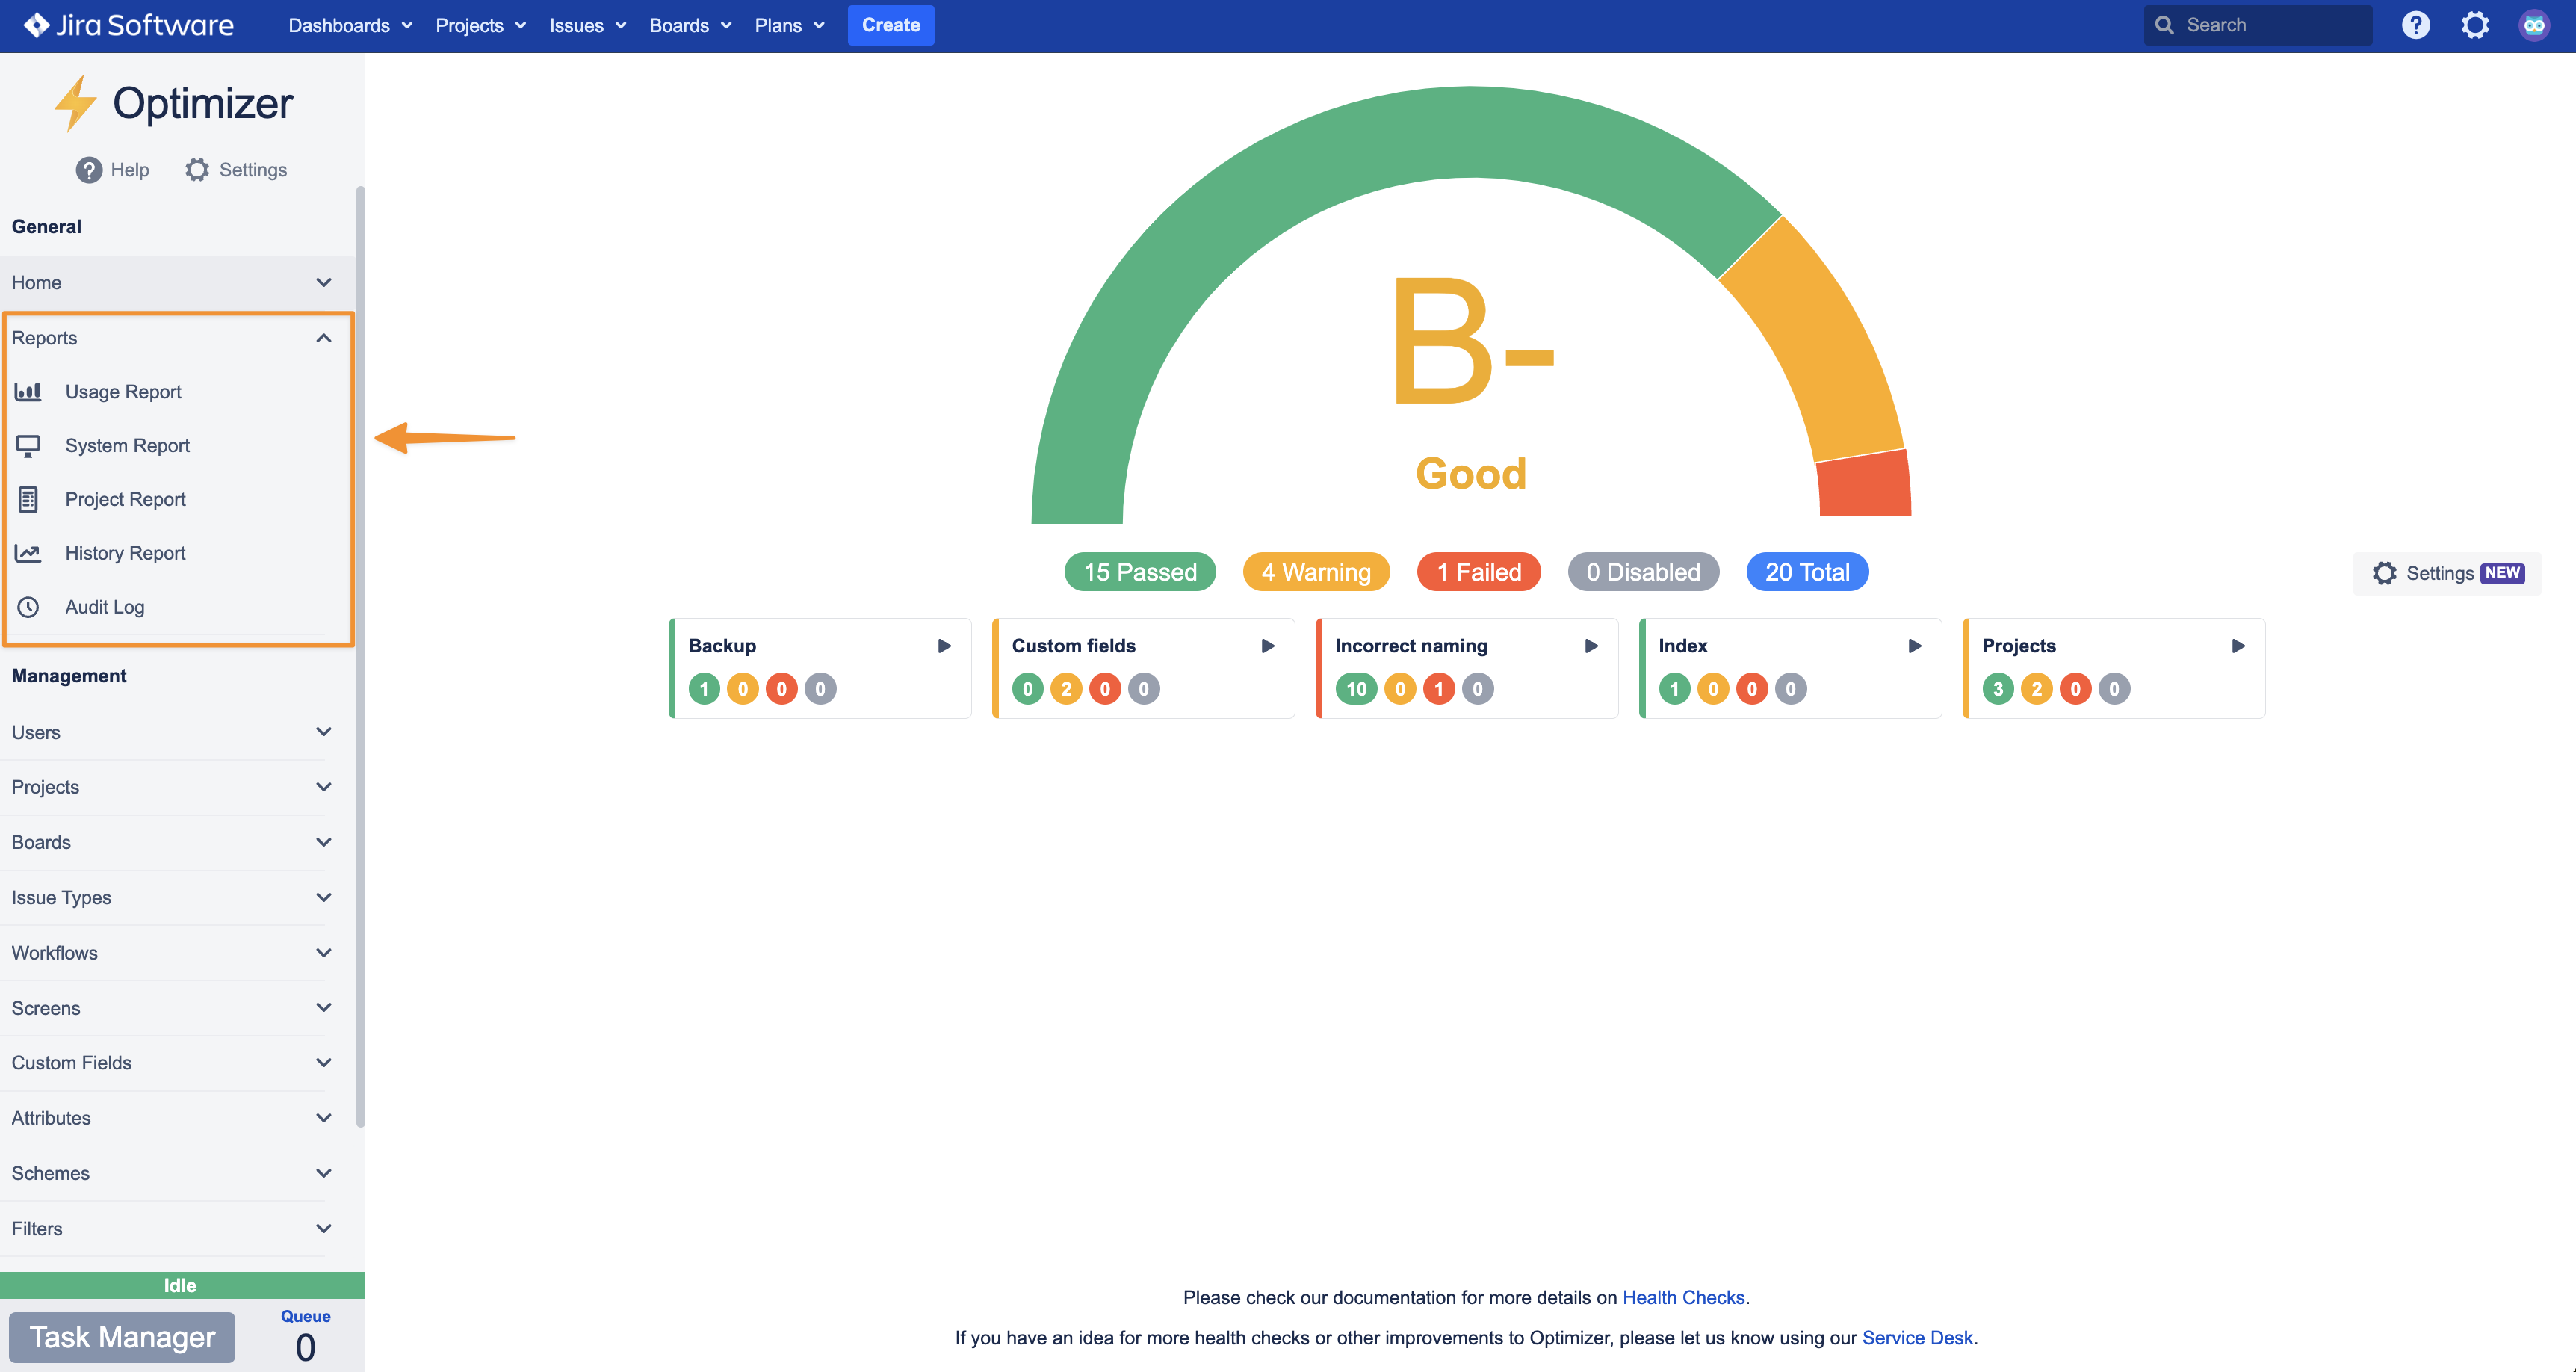
Optimizer’s reports can be accessed from anywhere within the app. As a reminder, you can access Optimizer by clicking the ⚙️ Settings icon in the top right of the screen and then on Optimizer.
To access a report, click Reports in the left navigation bar and select the report you wish to view.

Exporting Reports
Each of Optimizer’s reports can be exported in a variety of formats.
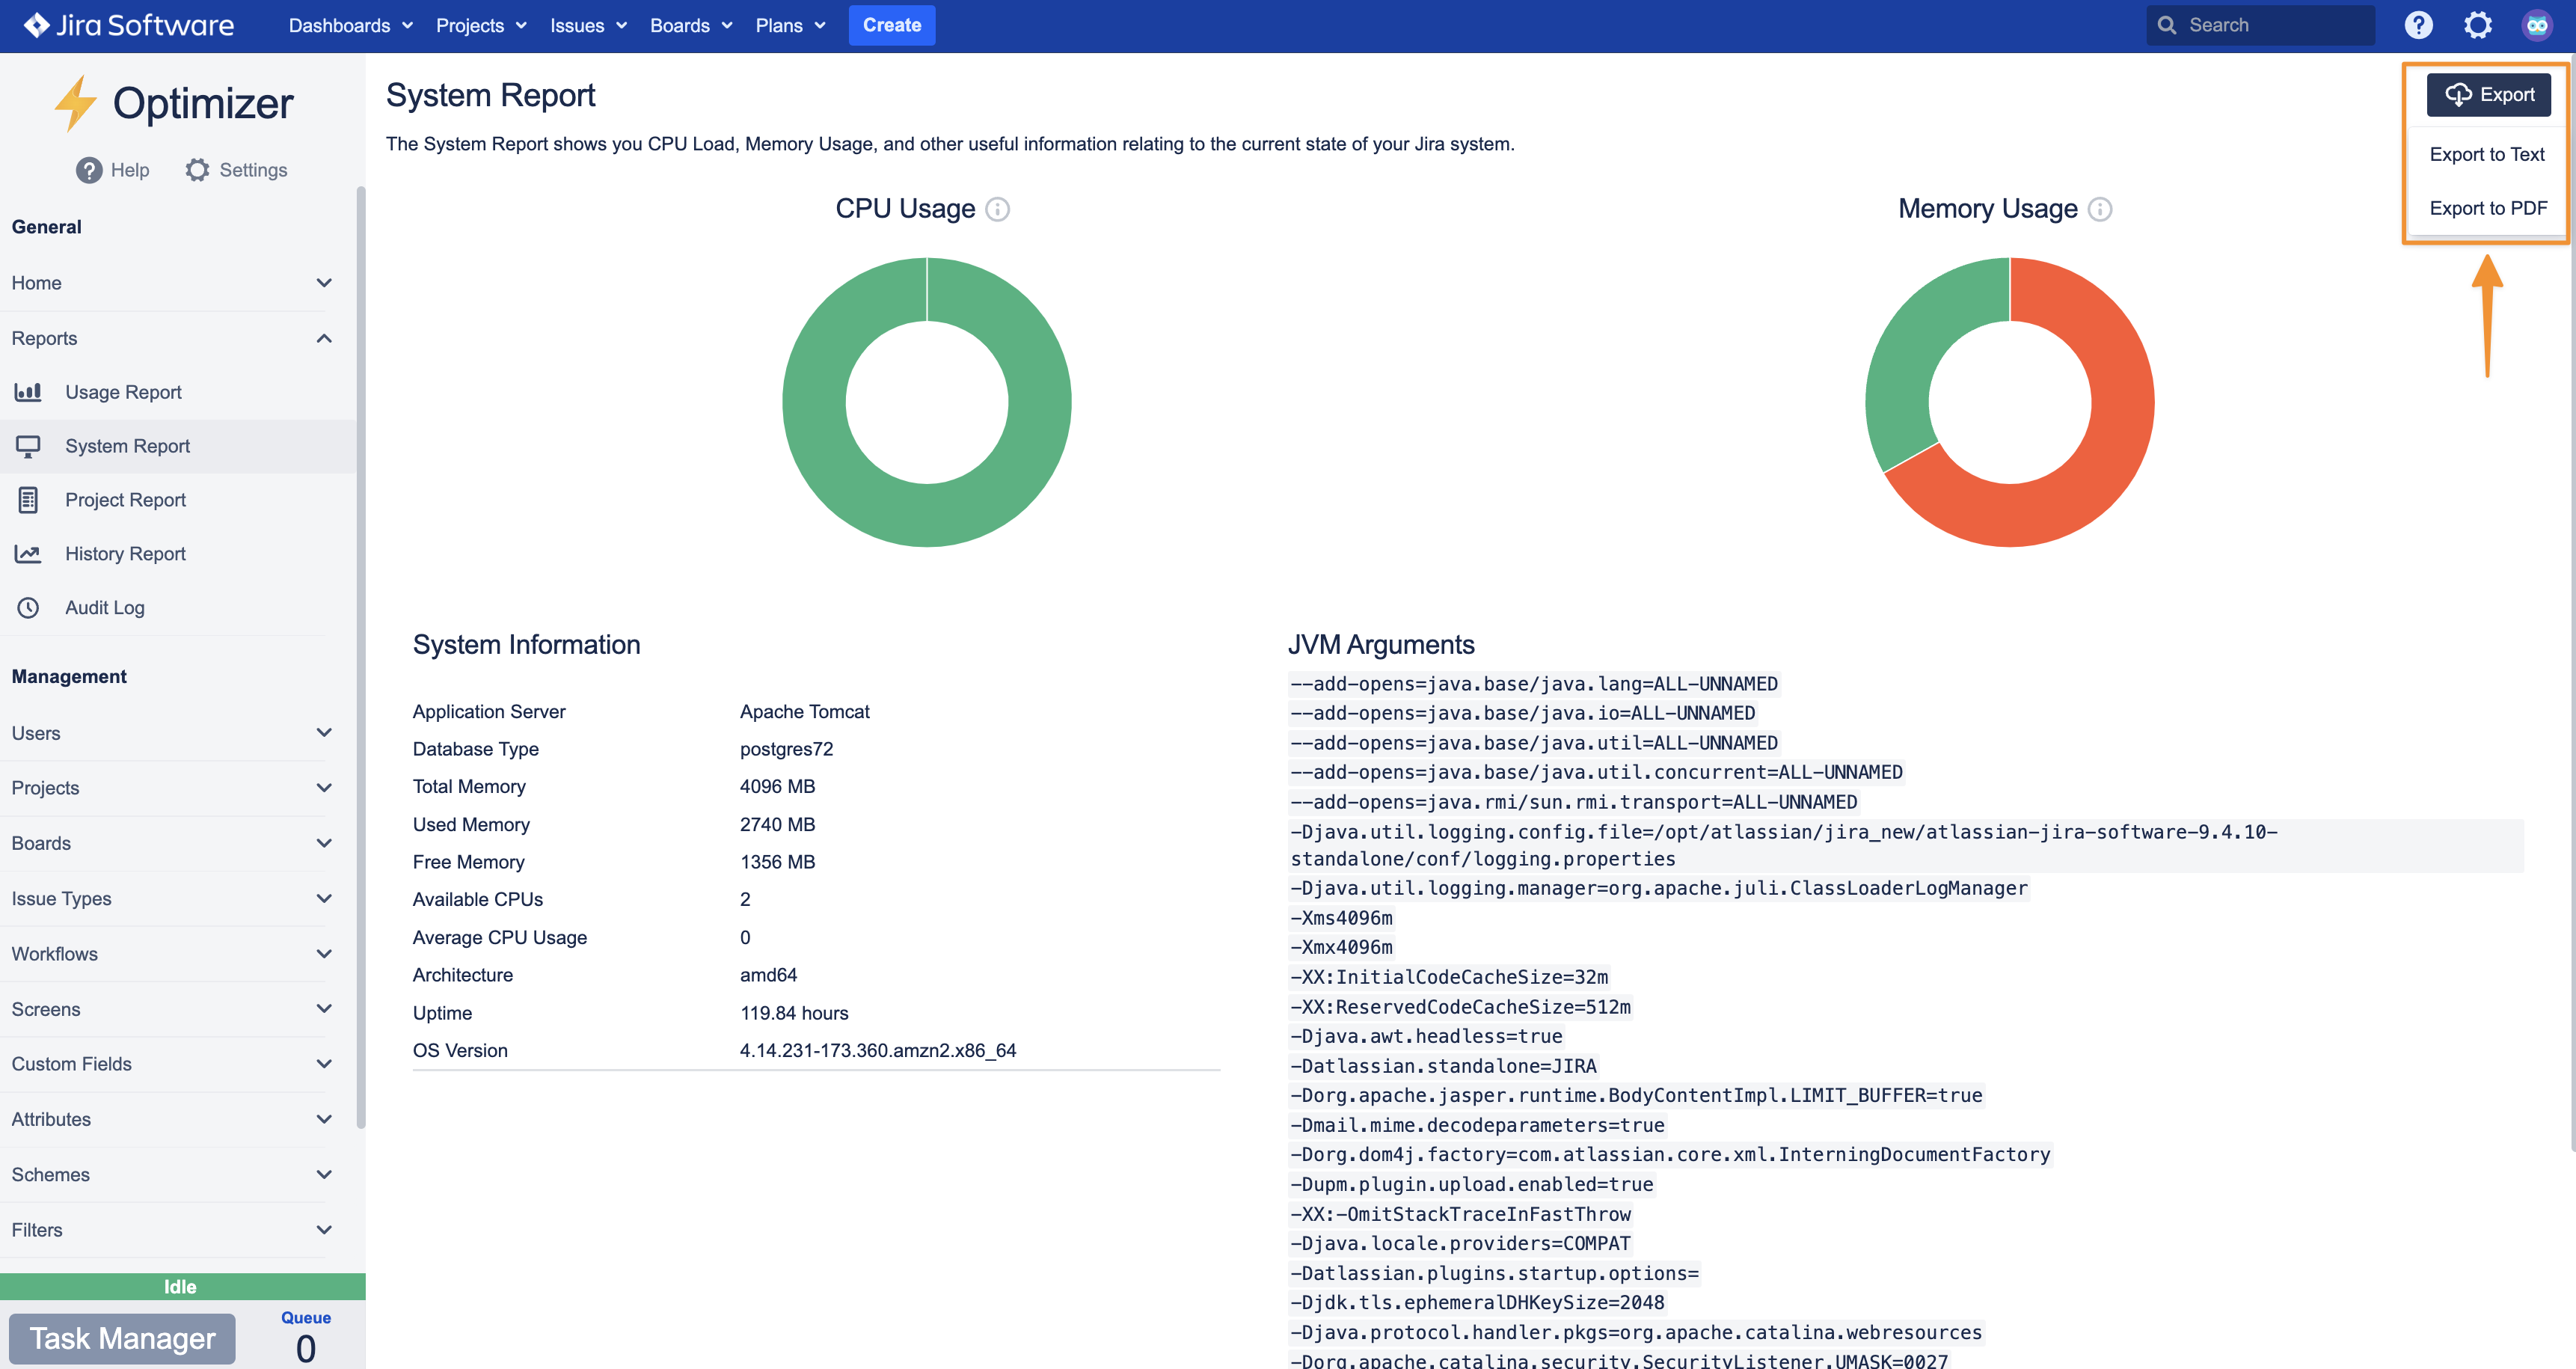
To export a report, click the Export button in the top right corner of the report’s page and select the desired format.

Export your Reports into CSV or PDF format
Customizing Report Exports
Some of the reports allow for some customization of the exports by filtering out irrelevant data.
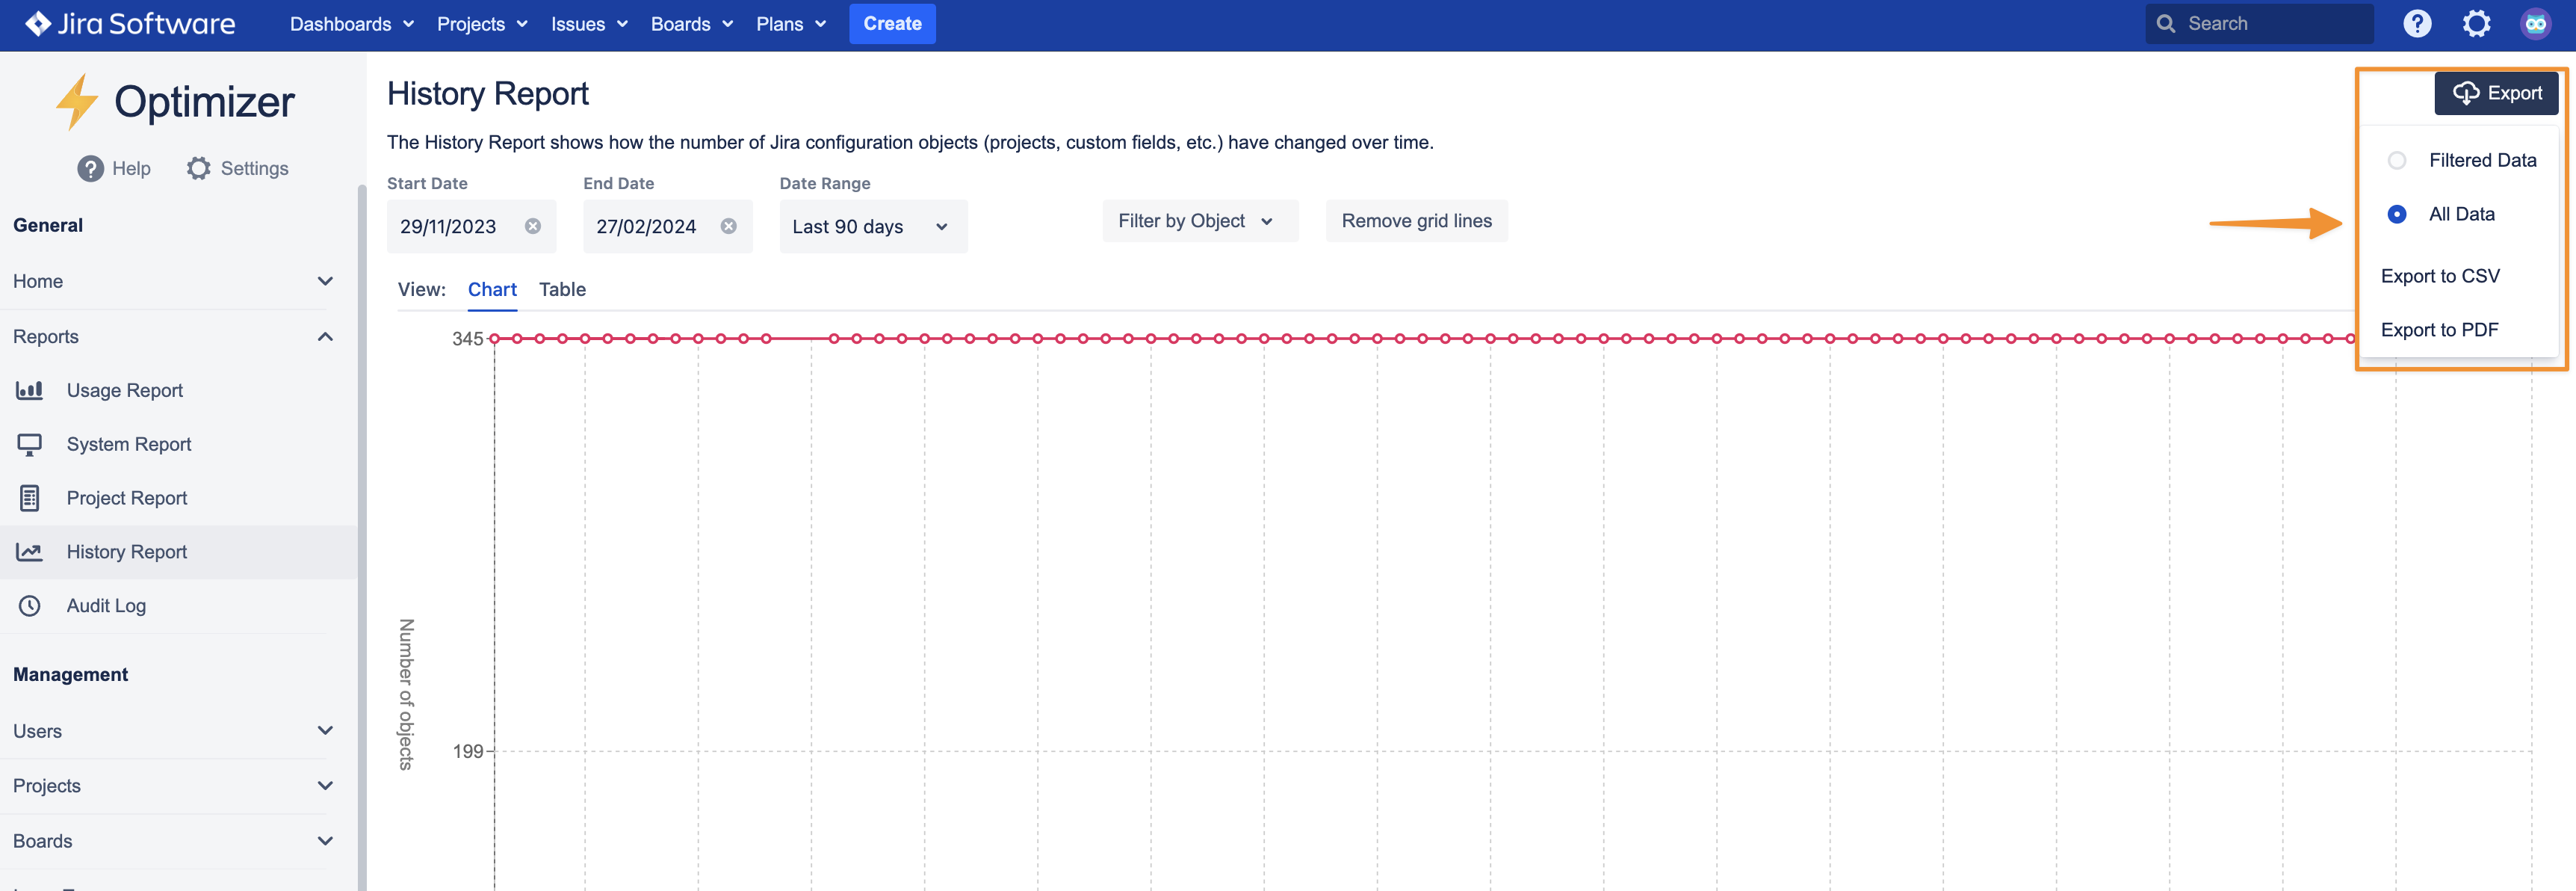
To customize an export, first, select the relevant filters for the data (for example, some reports allow a date range and relevant objects to be selected). Then, click on the Export button in the top right of the page, ensure the Filtered Data option is selected and select the desired export format.

Customize how your Reports are exported
Export Formats
Each of the reports has 2 available export formats: a raw data format and PDF.
The raw data format will be one of the following:
CSV (Comma Separated Value)
this format contains each row of a table as a line with columns separated by columns
it is a standard format that is widely supported by spreadsheet programs such as Microsoft Excel
Text
this format is for reports that contain multiple tables, each table in the report will have a heading followed by CSV data in the export
The PDF format will appear similar to the appearance of the report within the app and will contain any graphs and tables shown in the report within Optimizer.
.svg)