-20250819-084018.svg)
The usage report lets you view and analyze how Optimizer for Jira has been used to manage your Jira Configuration. It shows how many objects (for example, projects or custom fields) have been created, updated, or deleted using Optimizer for Jira.
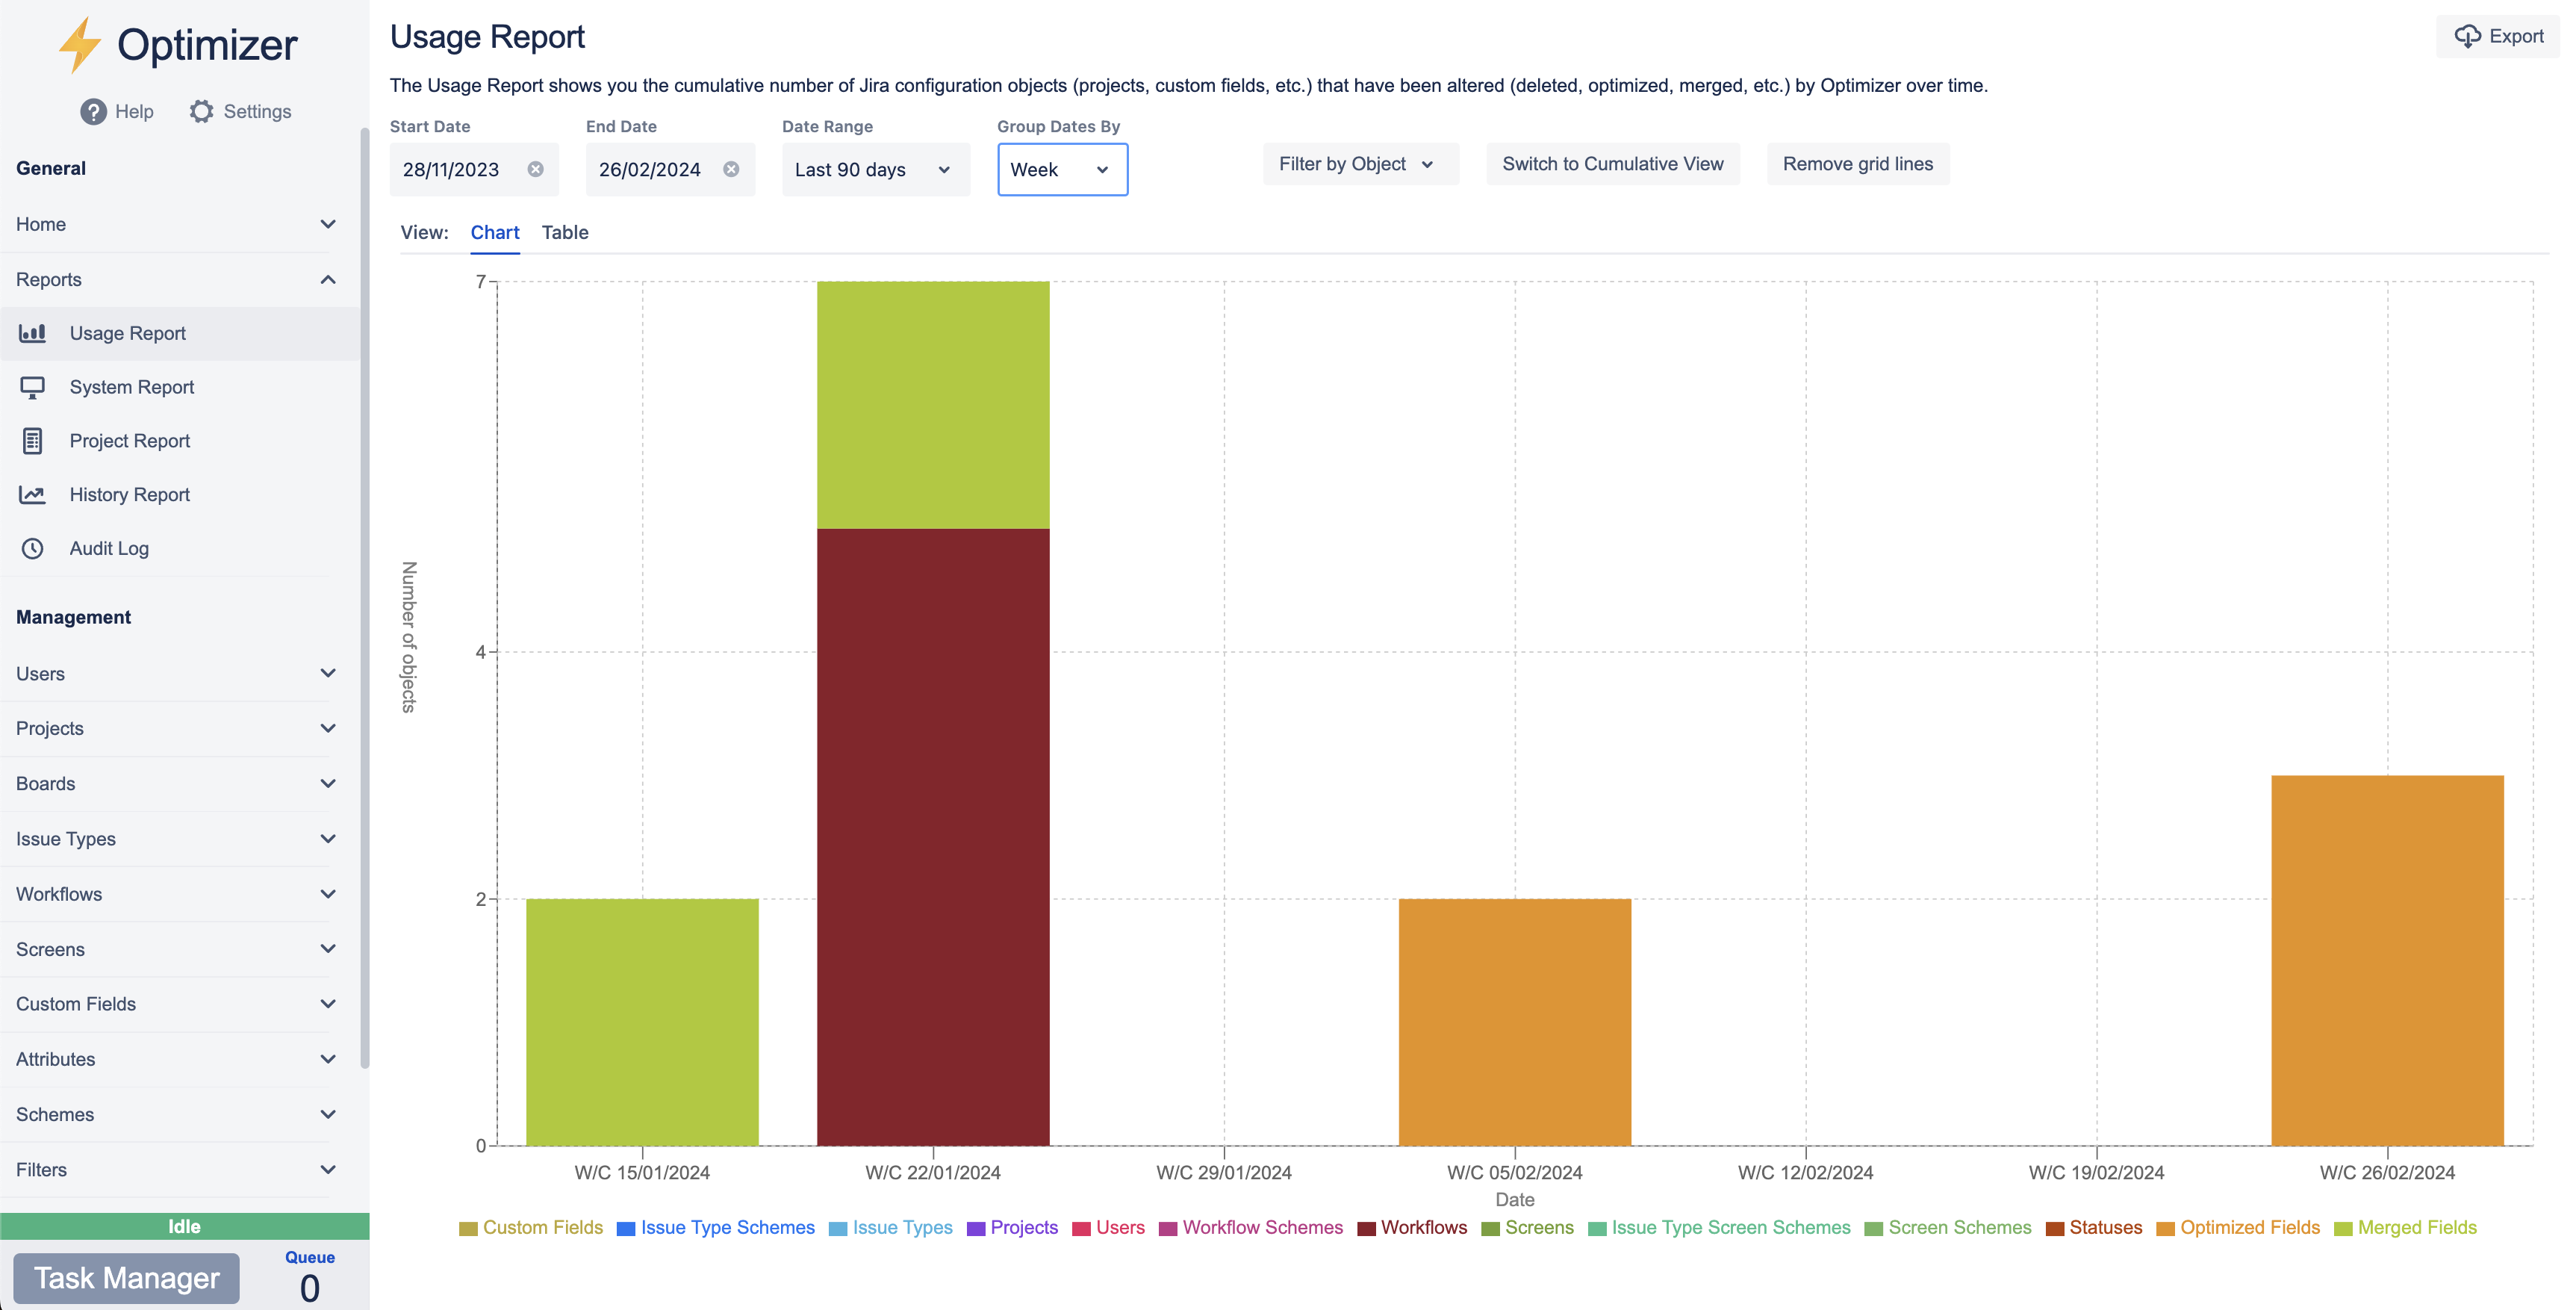
Filtering
The Usage Report has a variety of filtering options for the data.
You can select the range of dates that you want to see information for, choosing from preset options or manually selecting a custom date range.
You can also filter by what type of Jira configuration object the usage affects.
Granular or Cumulative view
There are 2 main options for how the usage information is presented to you: granular and cumulative.
The default option is granular. This groups the usages by day, week, month, quarter or year and presents the number of usages in each time interval in a bar chart or a table.
The cumulative option shows the total number of usages (by type) up to each date. The information is presented in either a line chart or a table.
Exporting
The Usage Report can be exported in either CSV or PDF format. The export can be customized according to the currently selected filters and view.
You can find more information about exporting reports here.