Sensitive Data
Overview
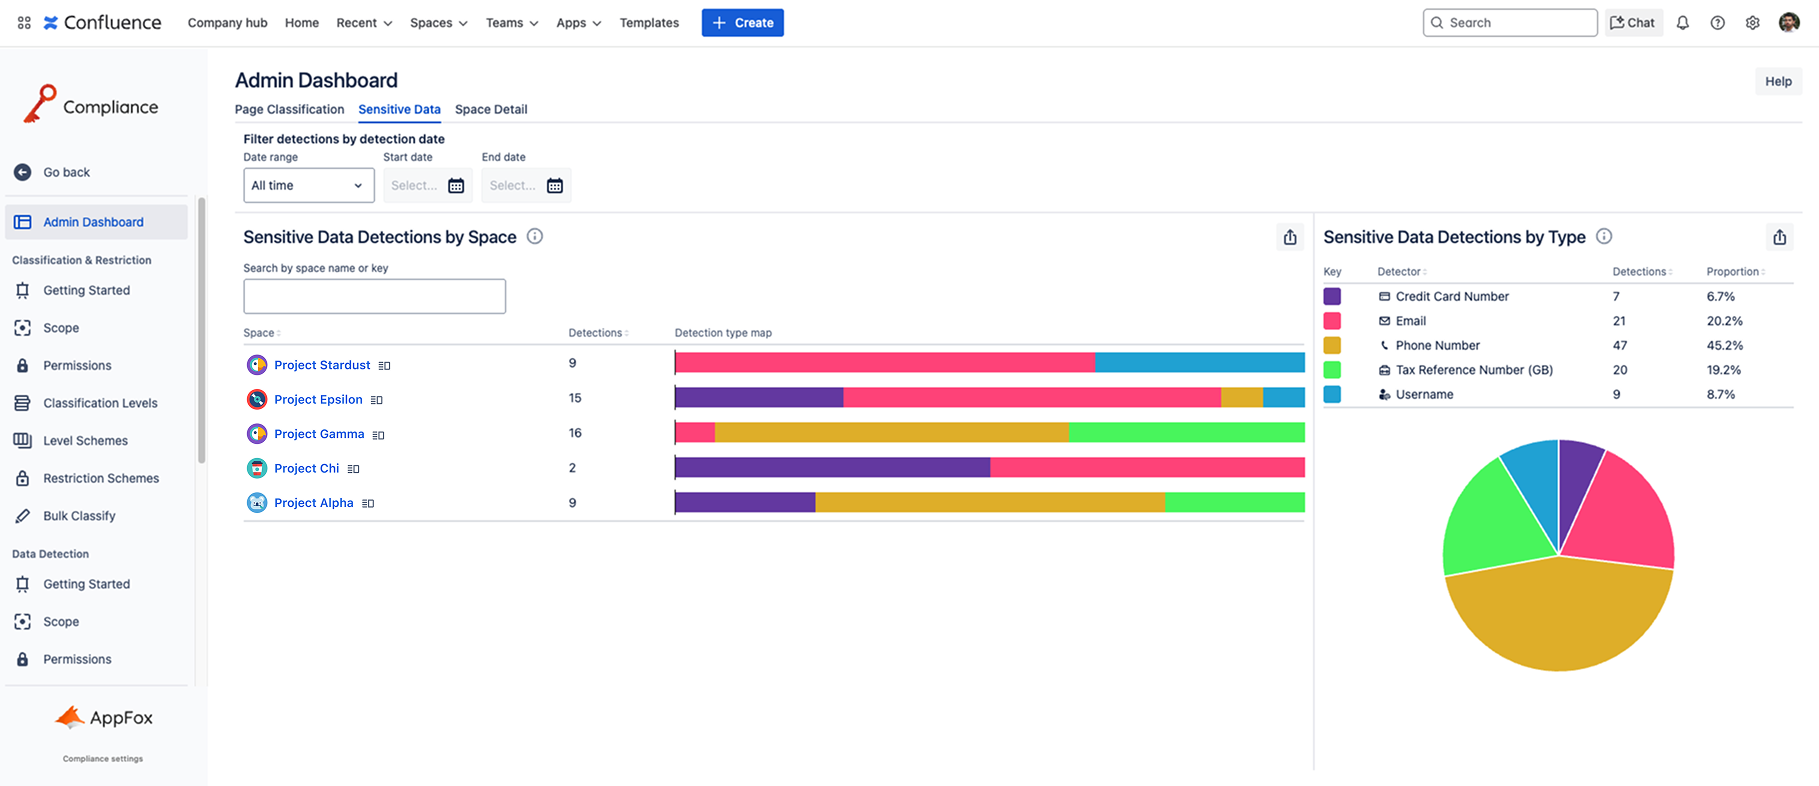
The Sensitive Data Dashboard provides comprehensive visual and data-driven insights into data detections across your Confluence instance. With separate sections for detections by space and by type, administrators can quickly identify what kinds of sensitive data have been detected within Confluence and pinpoint where these have been introduced.

You can also set a date range to filter the results based by detection time. For example, filtering by ‘Month to date’ will show you data detections that have been detected since the start of the current month.
Sensitive Data Detections by Space
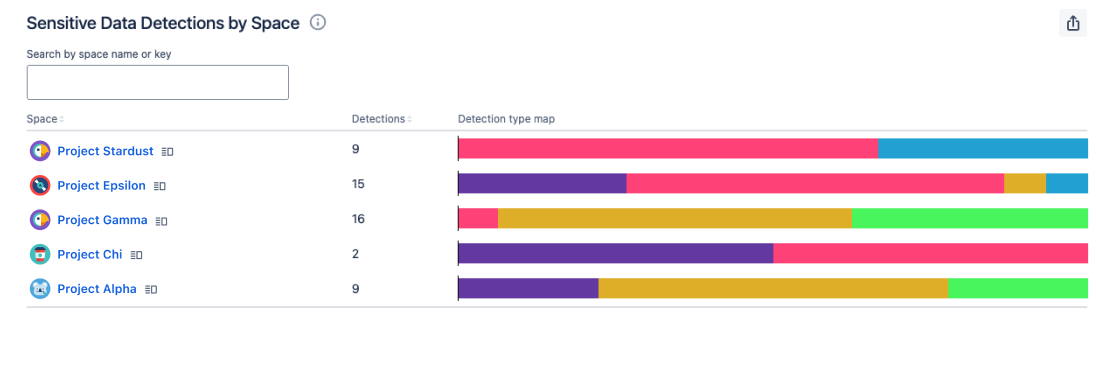
This table provides an overview of data detections for each Confluence space. It displays the total number of detections as well as a detection type map showing the distribution of detection types (email addresses, credit card numbers, etc.).

The table displays Confluence spaces with detections that the user has access to.
The table provides search, allowing you to locate spaces by name or key. You can sort by space name (for easily locating spaces) or by number of detections (to find spaces with the most/least detections). You can also export the data in the table to CSV format. Clicking on the name of a space will take you to that space.
Sensitive Data Detections by Type
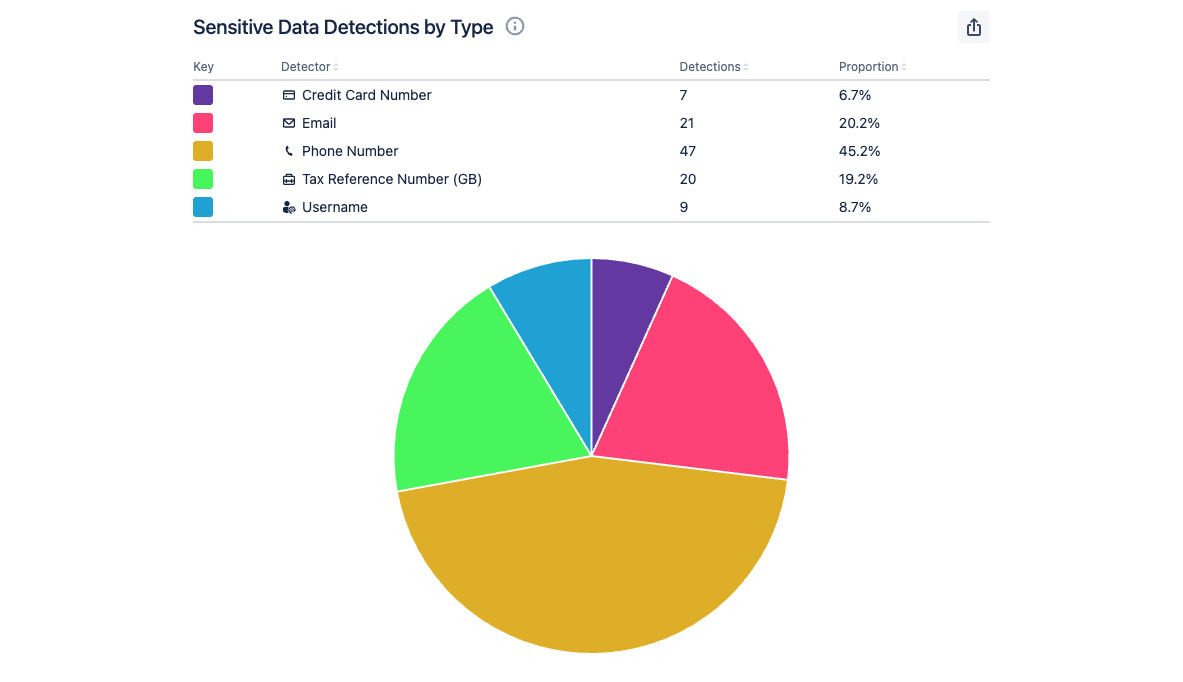
This section provides an overall summary of data detections across the entire Confluence instance. It highlights the prevalence of each detection type by displaying the total number of detections identified, and calculates the proportion each detection type represents within the instance.

The tables allows you to sort by detector, detection count, or proportion. You can also export the data to CSV format. A pie chart provides a visual representation of the data within the table.
Need support? We’re here to help 🧡
If you have any questions or would like to speak with us, please don’t hesitate to reach out to our Customer Support team.
%20v2.png)