Page Classification
Overview
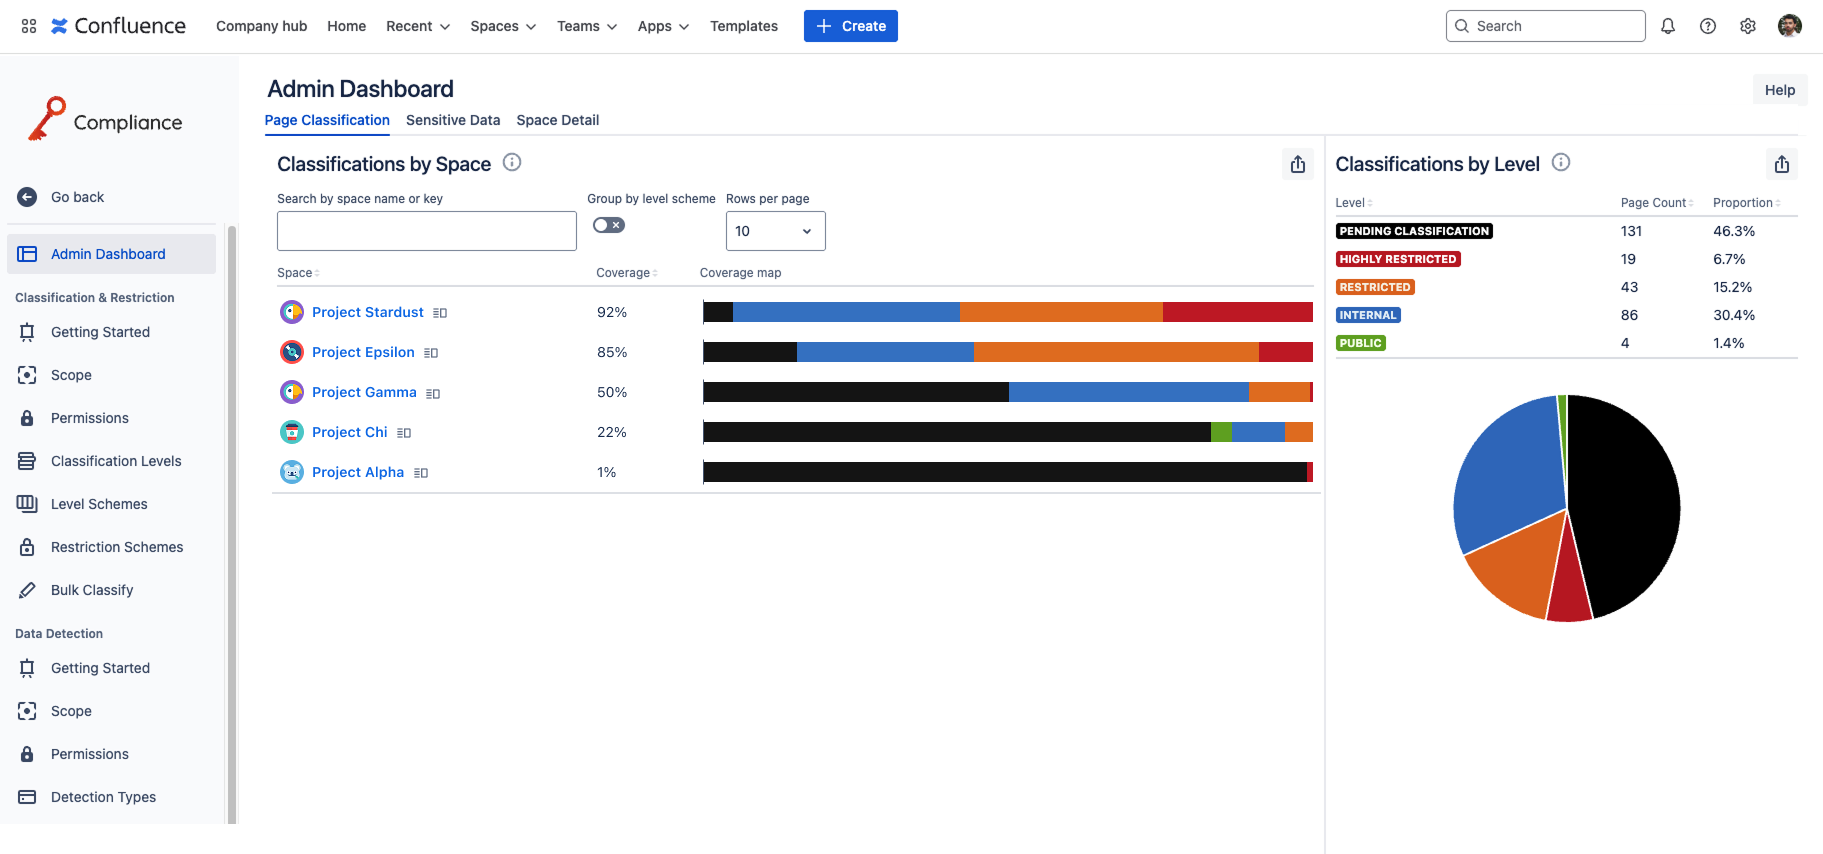
The Page Classification Dashboard provides comprehensive visual and data-driven insights into classifications across your Confluence instance. With separate sections for classifications by space and by level, administrators can quickly identify compliance gaps and assess the distribution of classification levels across all Confluence pages.

Classifications by Space
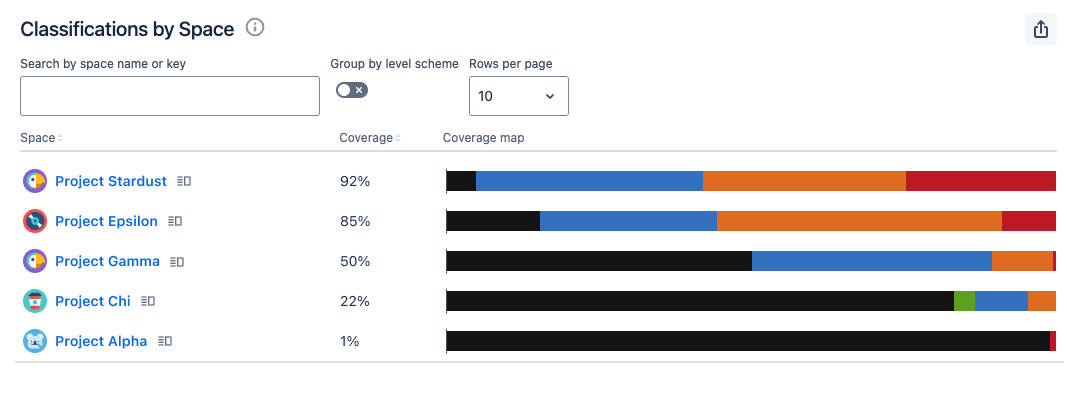
This table provides an overview of classification level usage for each Confluence space. It displays the coverage, indicating the percentage of pages that have been assigned a classification level, and a coverage map, visually representing how classification levels are distributed across Confluence pages.

The table displays Confluence spaces that have classifications and that the user has access to. For each Space, the following key insights are given:
Pending Classifications: The number of active pages (both published and draft) that have not yet been assigned a classification level. Pages that are trashed or archived are excluded, as they cannot have a level applied and therefore are not considered pending.
Classifications: The distribution of classification levels within the space, which gives the number of pages that have a classification level assigned. This includes active pages (both published and draft) as well as trashed and archived pages (since these retain their classification levels when restored and are still considered part of the space even though they are hidden).
Coverage Percentage: The percentage of pages that have been assigned a classification level. A high coverage indicates strong adoption of your Compliance classification policies for the space.
The table provides search, allowing you to locate spaces by name or key. You can sort by space name (for easily locating spaces) or by coverage (to find the best/worst spaces for classification adoption). You can also export the data in the table to CSV format. Clicking on the name of a space will take you to that space.
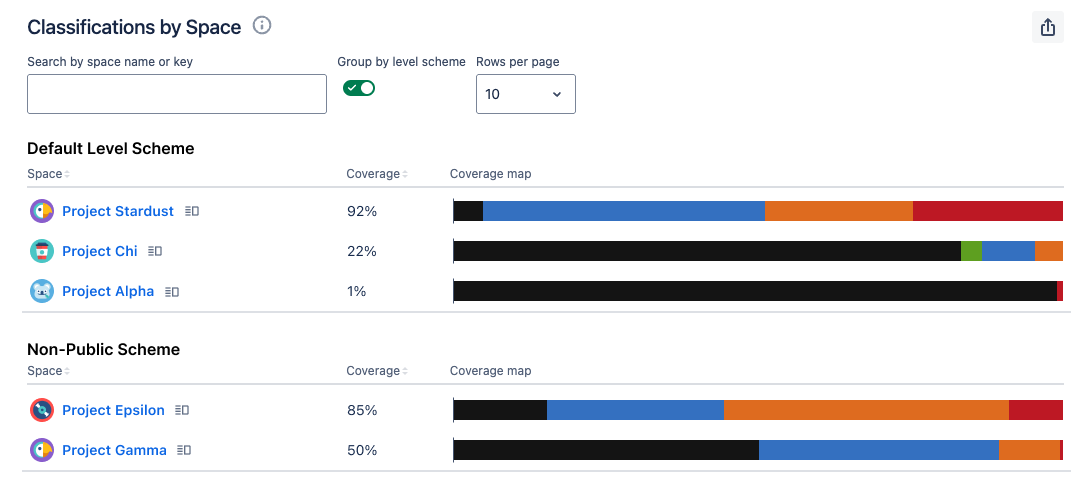
Additionally, if your Confluence instance uses multiple level schemes, you can group the table by scheme to gain clearer insights into how classification levels are used within each configured scheme.

Classifications by Level
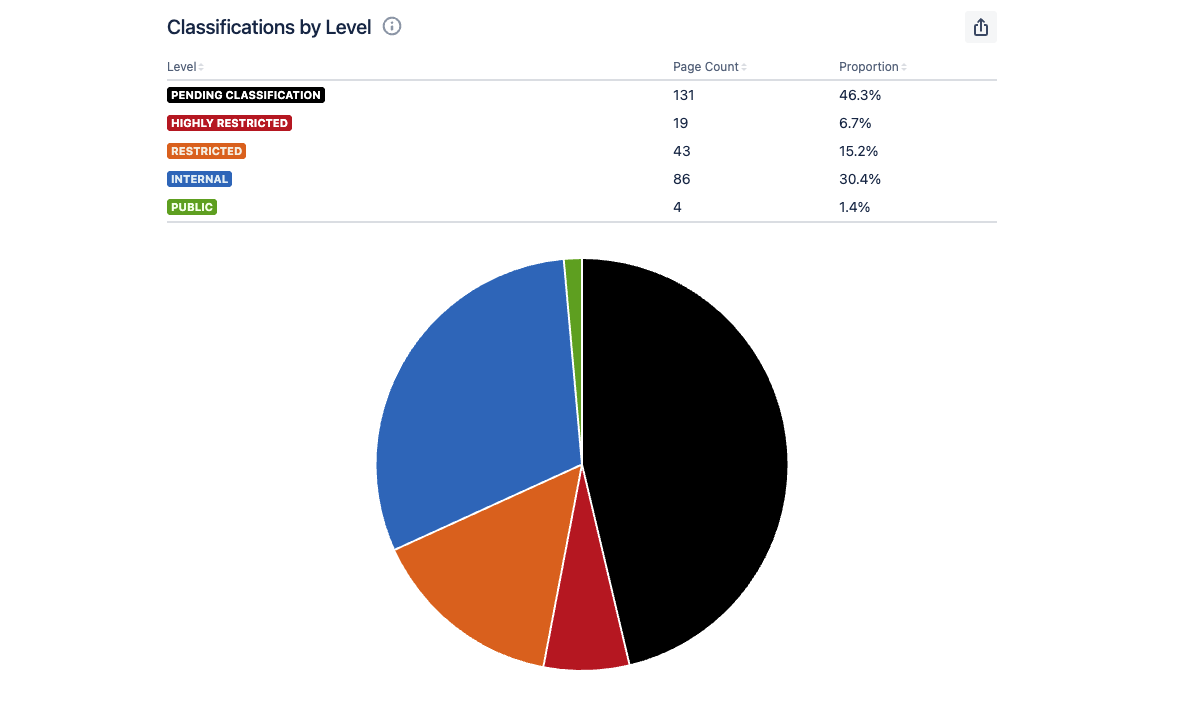
This section provides an overall summary of classification level usage across the entire Confluence instance. It highlights the prevalence of each level by displaying the total number of pages assigned to each level, and calculates the proportion each level represents within the instance.

The tables allows you to sort by level name, page count, or proportion. You can also export the data to CSV format. A pie chart provides a visual representation of the data within the table.
Need support? We’re here to help 🧡
If you have any questions or would like to speak with us, please don’t hesitate to reach out to our Customer Support team.
%20v2.png)