Health Checks are a great way to identify problems in Jira and save the time of your Jira Administrators. Optimizer for Jira comes with over 20 health checks which can be used to analyze your Jira instance and show warnings or errors when something is detected that is considered bad practice or incorrect.
To get started using the Health Checks in Optimizer, please use the table of contents below to navigate to the section you want to learn more about:
Accessing Health Checks
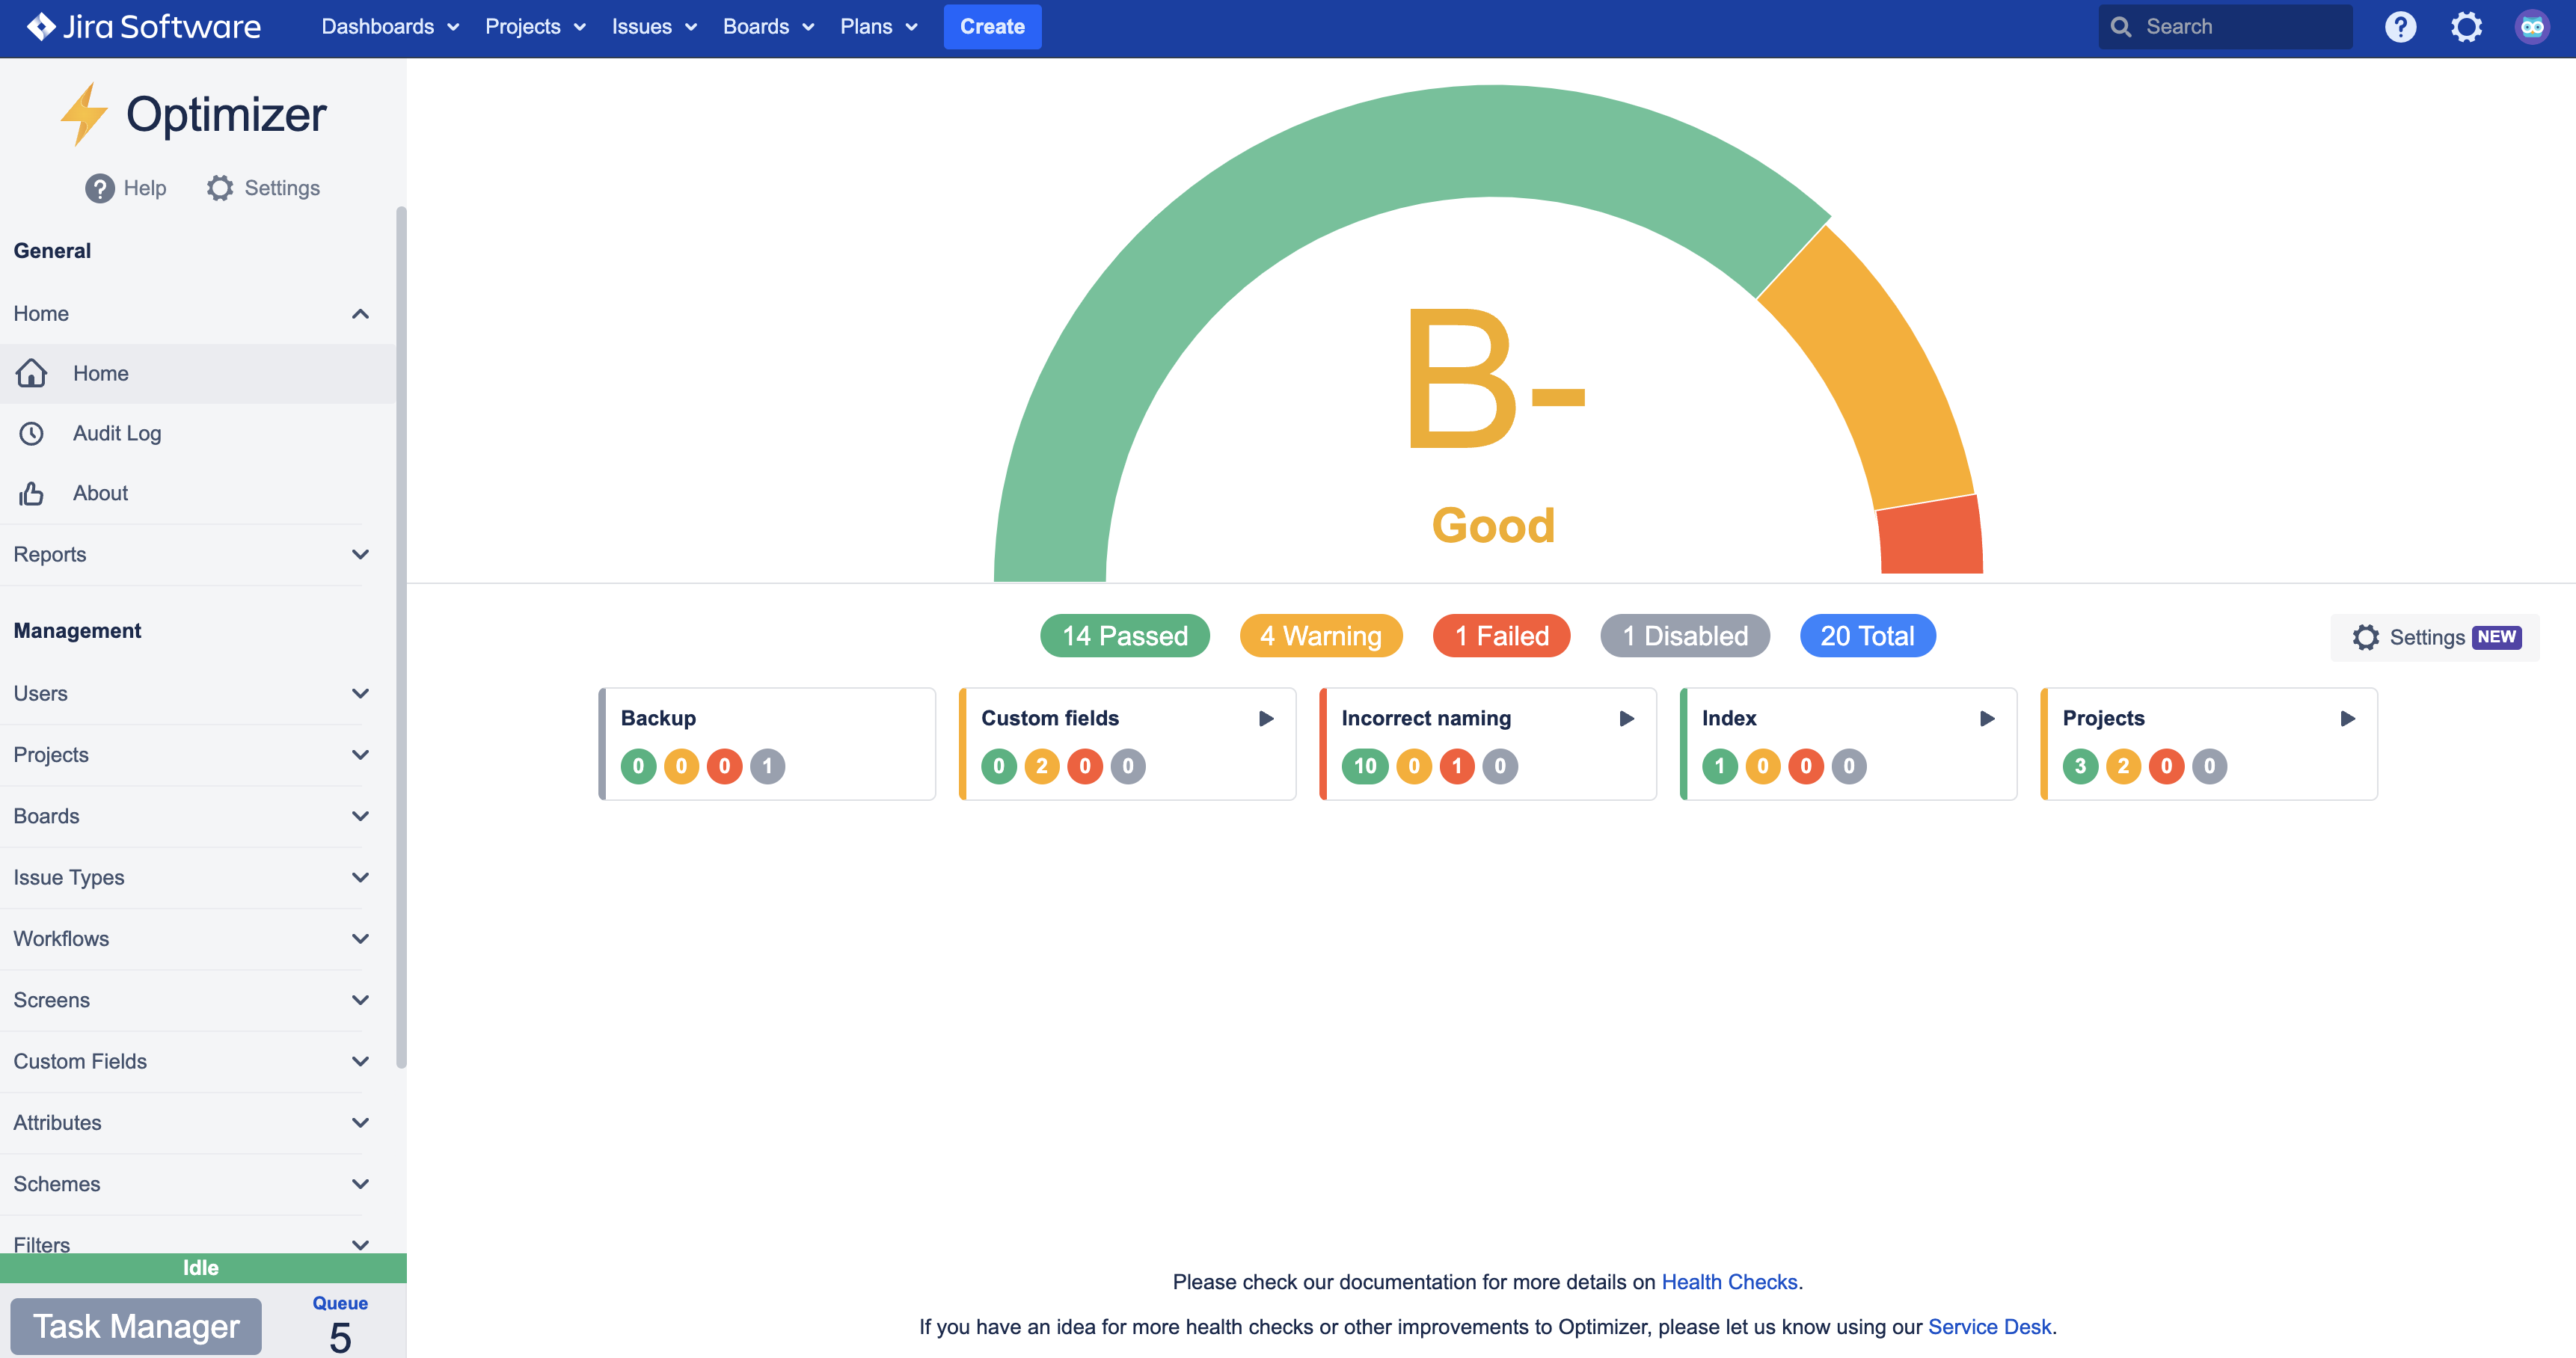
The Health Checks are displayed on Optimizer’s Homepage, it is the first thing you’ll see when you enter the app. As a reminder, you can access Optimizer by clicking the ⚙️ Settings icon in the top right of the screen and then on Optimizer.
You can also access the Homepage from anywhere within Optimizer by clicking the Home option under the Home section in the left-hand side navigation bar.
How Health Checks are scored
On the homepage, you’ll see an overview of the health check scores with a grade and a message about the state of your Jira instance.
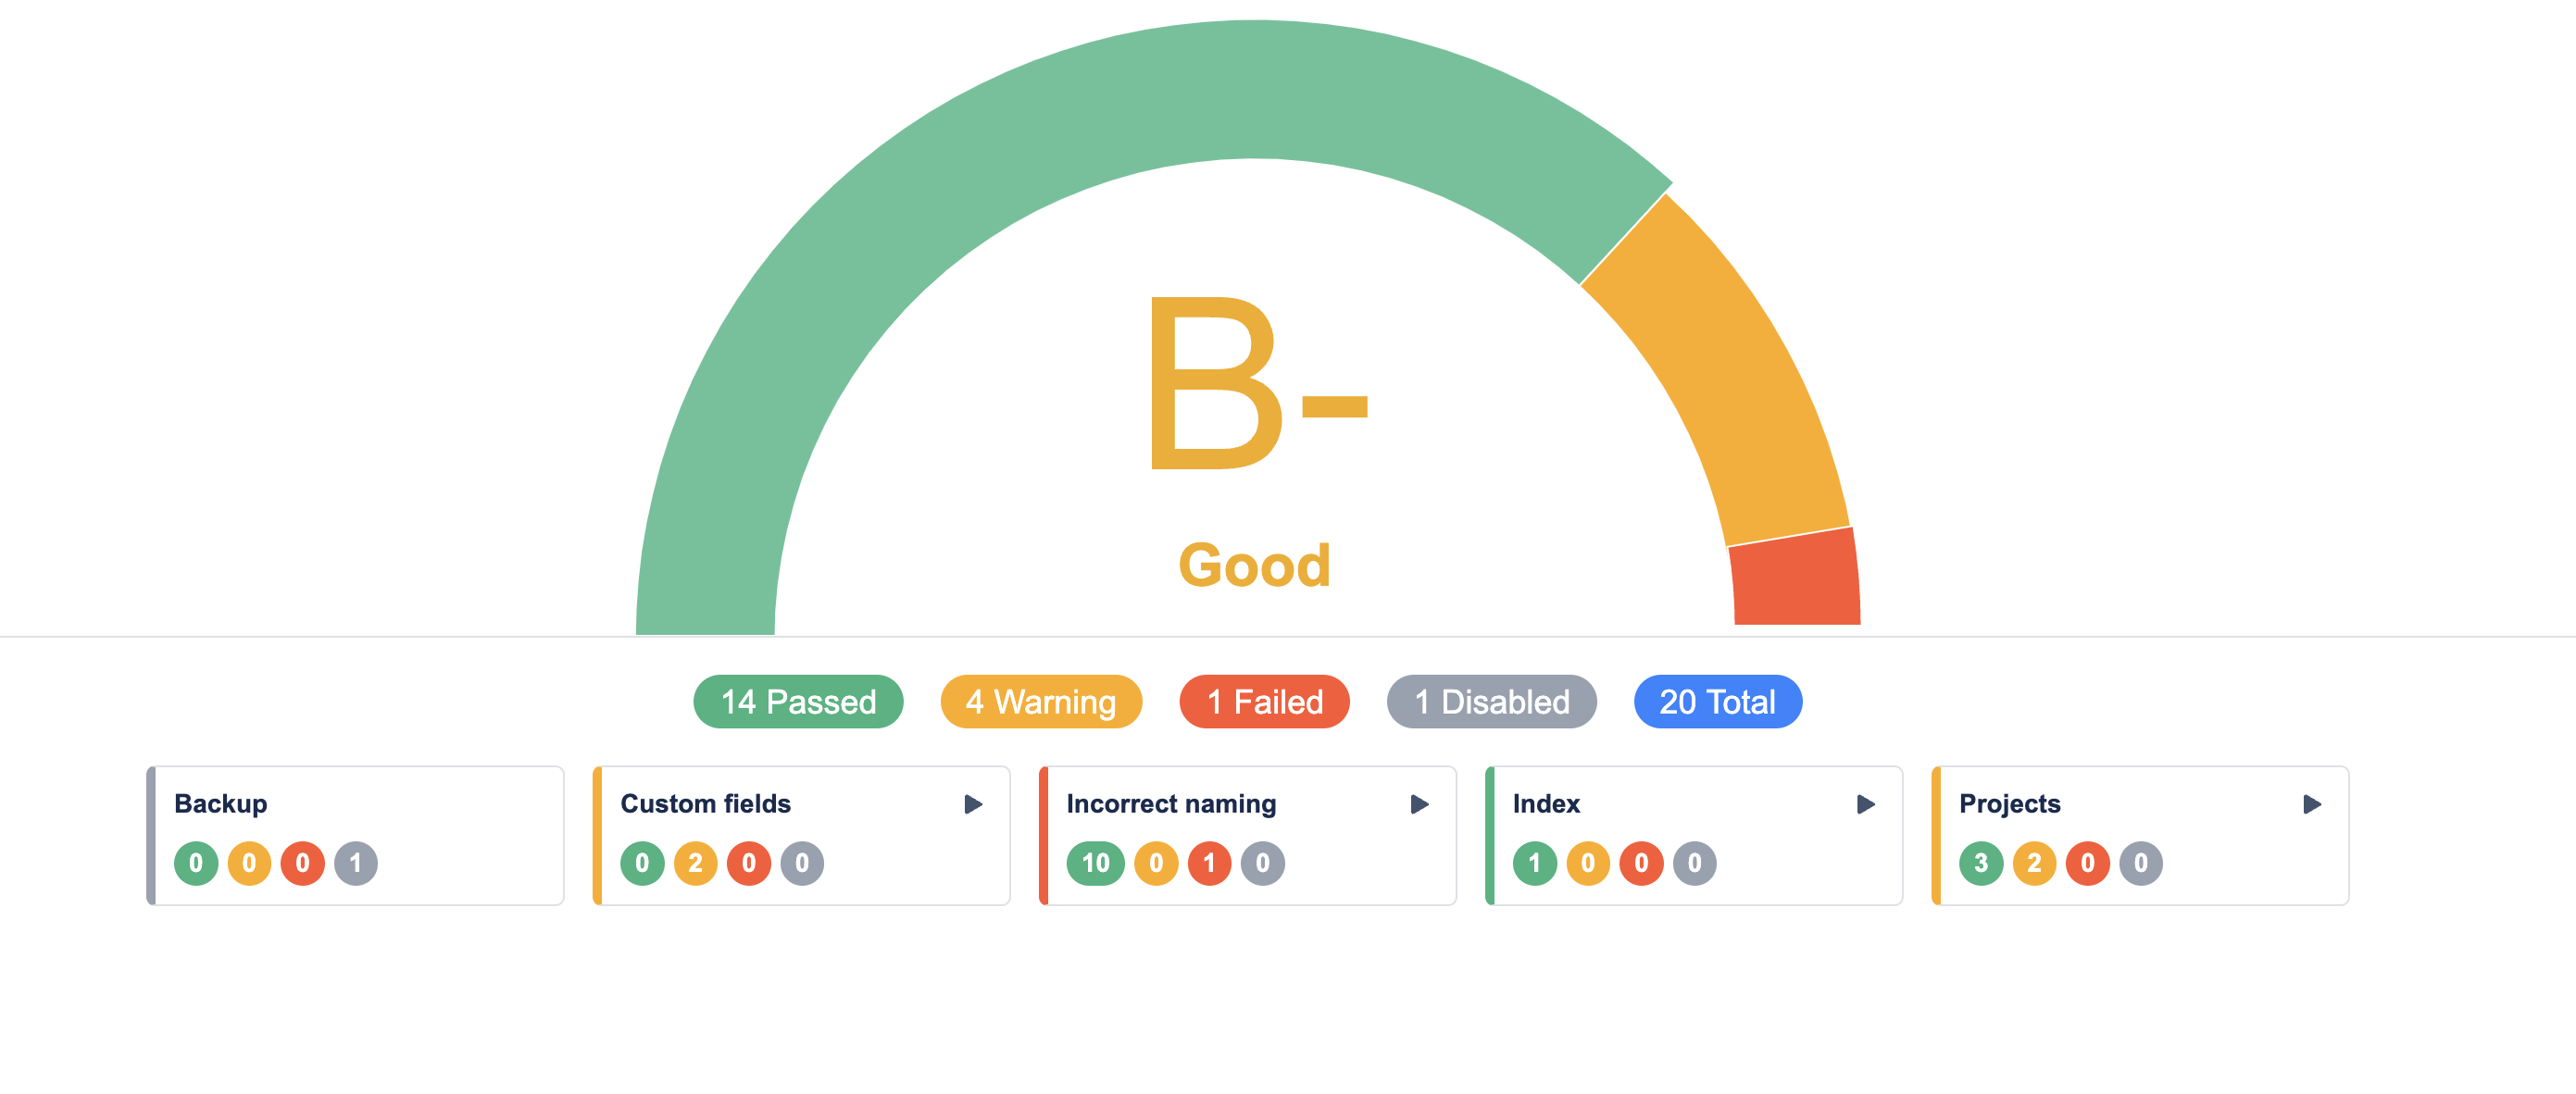
The grade is calculated from the number of Health Checks that have failed or have warnings and provides a good indicator of the health of your Jira instance.
Health Check Collections
For your convenience, Optimizer’s Health Checks are grouped into Collections. Each collection comprises several related Health Checks that focus on different areas.
There are collections for:
Each collection is displayed as a card containing a summary of how many health checks within the collection passed, had warnings, failed, or were disabled. This lets you quickly focus on the Health Check results that most need improvement.
Clicking on a collection card will take you to an overview of the health checks within that collection, allowing you to see at a glance the state of each health check, when it last ran, and how many results there are.
Running Health Checks
By default, Optimizer’s health checks run automatically once per day but it is also possible to manually run health checks to get more up to date information. For instance, if you take action based on the results of a health check, then a manual re-run will allow you to quickly see any improvements reflected in your score, and corresponding updated results.
Health checks can be run either individually or by collection.
To run an individual health check, click on the card for the collection the health check belongs to and then click on the ▶️ run icon in the row for that health check.
To run a collection of health checks, you can click on the ▶️ run icon in the top right of a collection’s card on the homepage.
You can’t run health checks that have been disabled in your configured health check settings.
Viewing Health Check Results
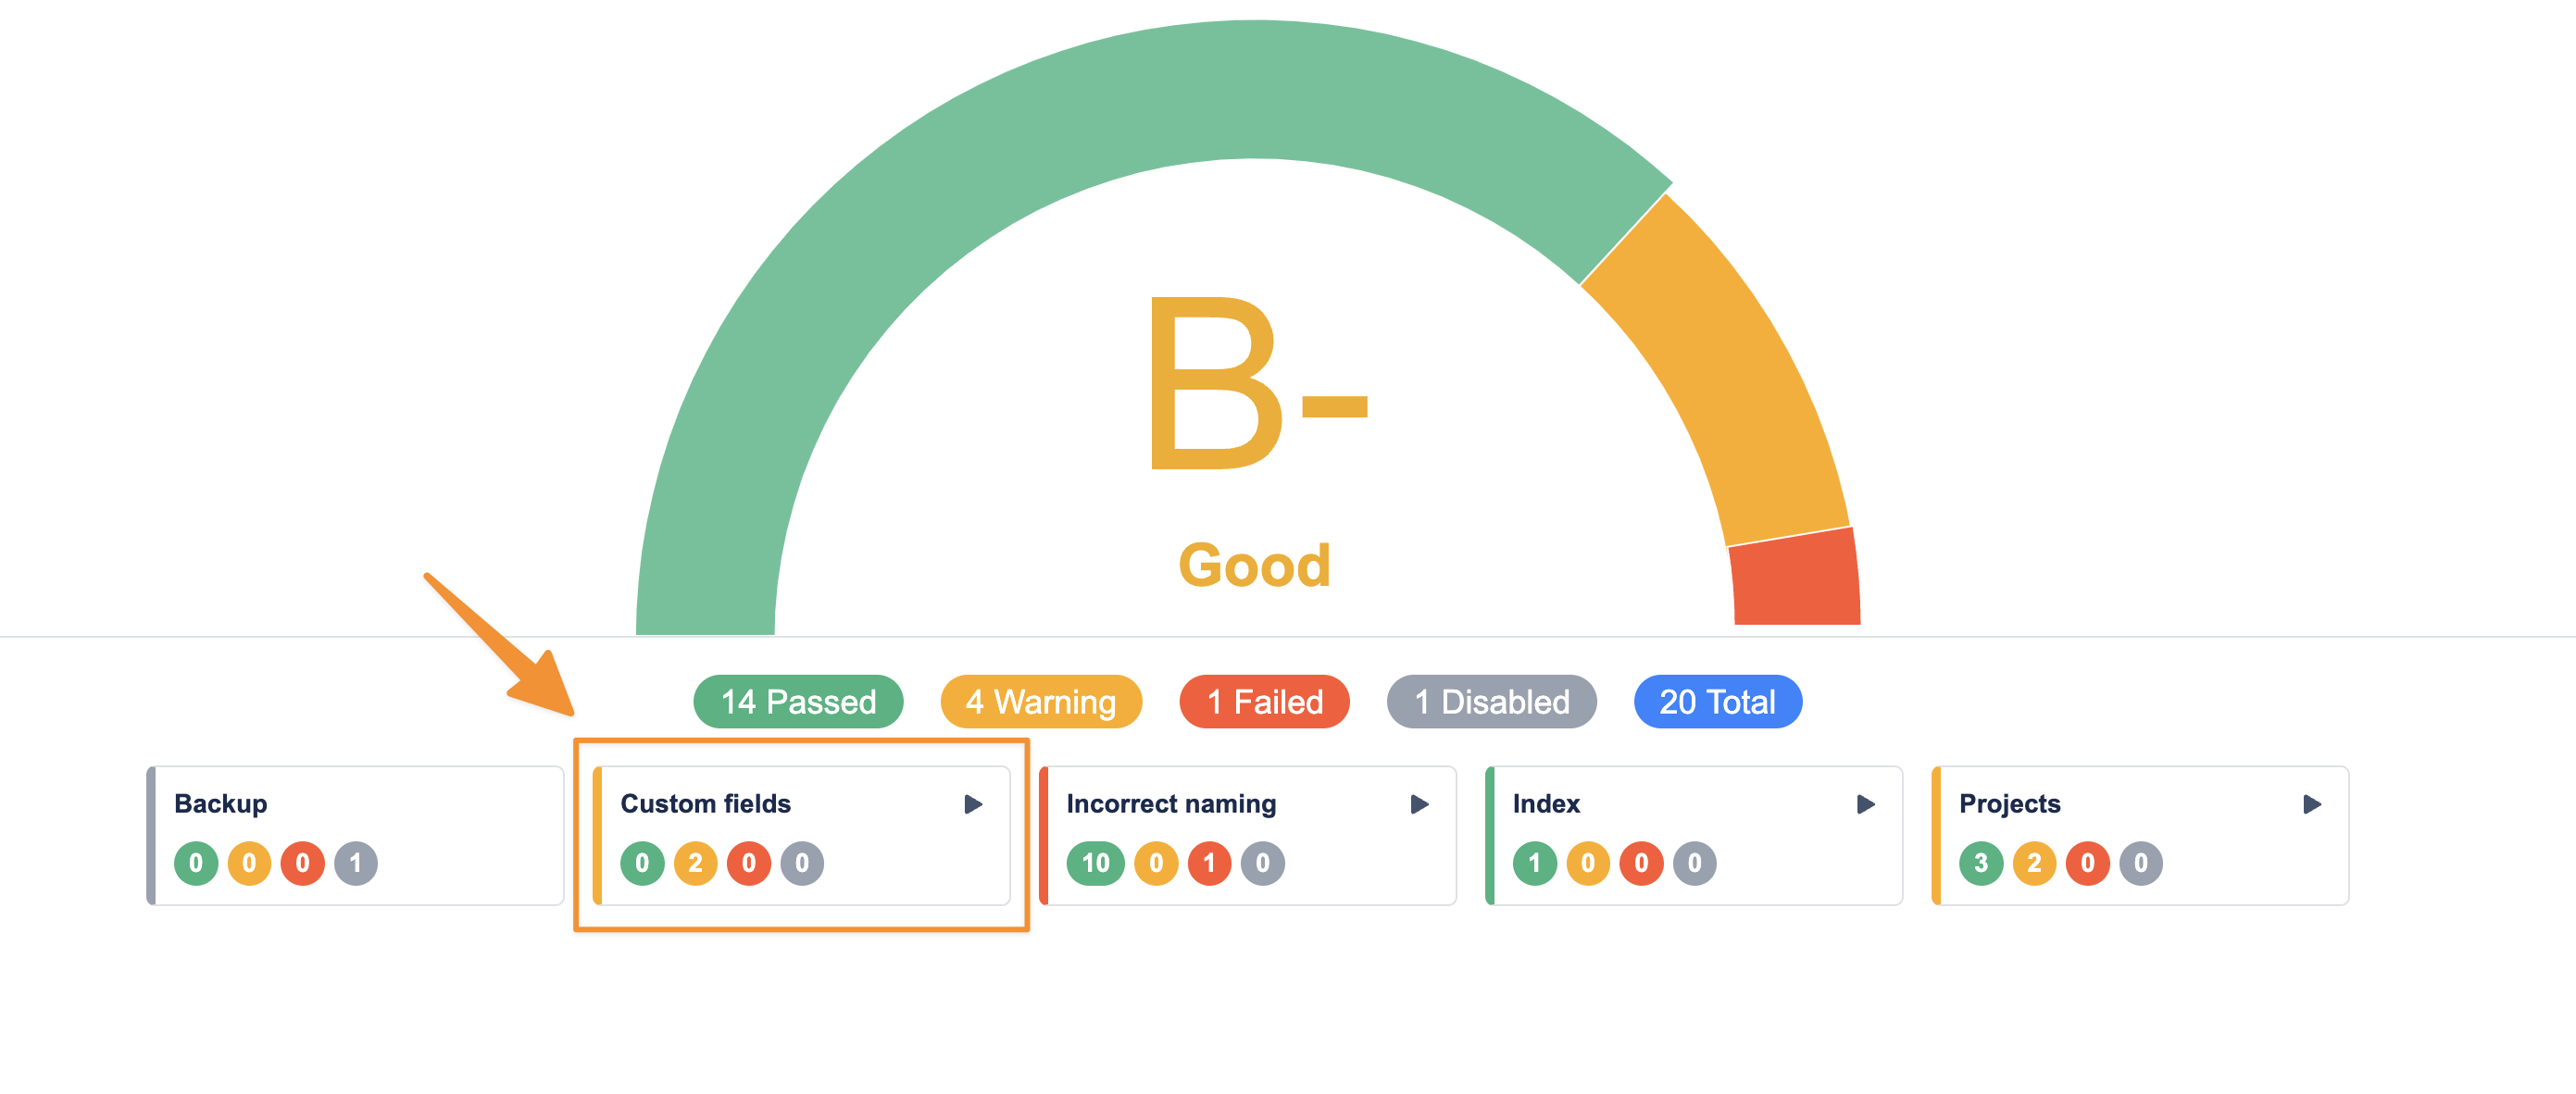
In order to view the results of a health check, click on the collection card (e.g., Custom Fields) as shown below.
Once you have clicked into the collection, you will be able to see all the different checks that Optimizer has run on your Jira instance. In the example below, you can see that the Custom Field collection has run two checks;
-
Global custom fields
-
Unused custom fields
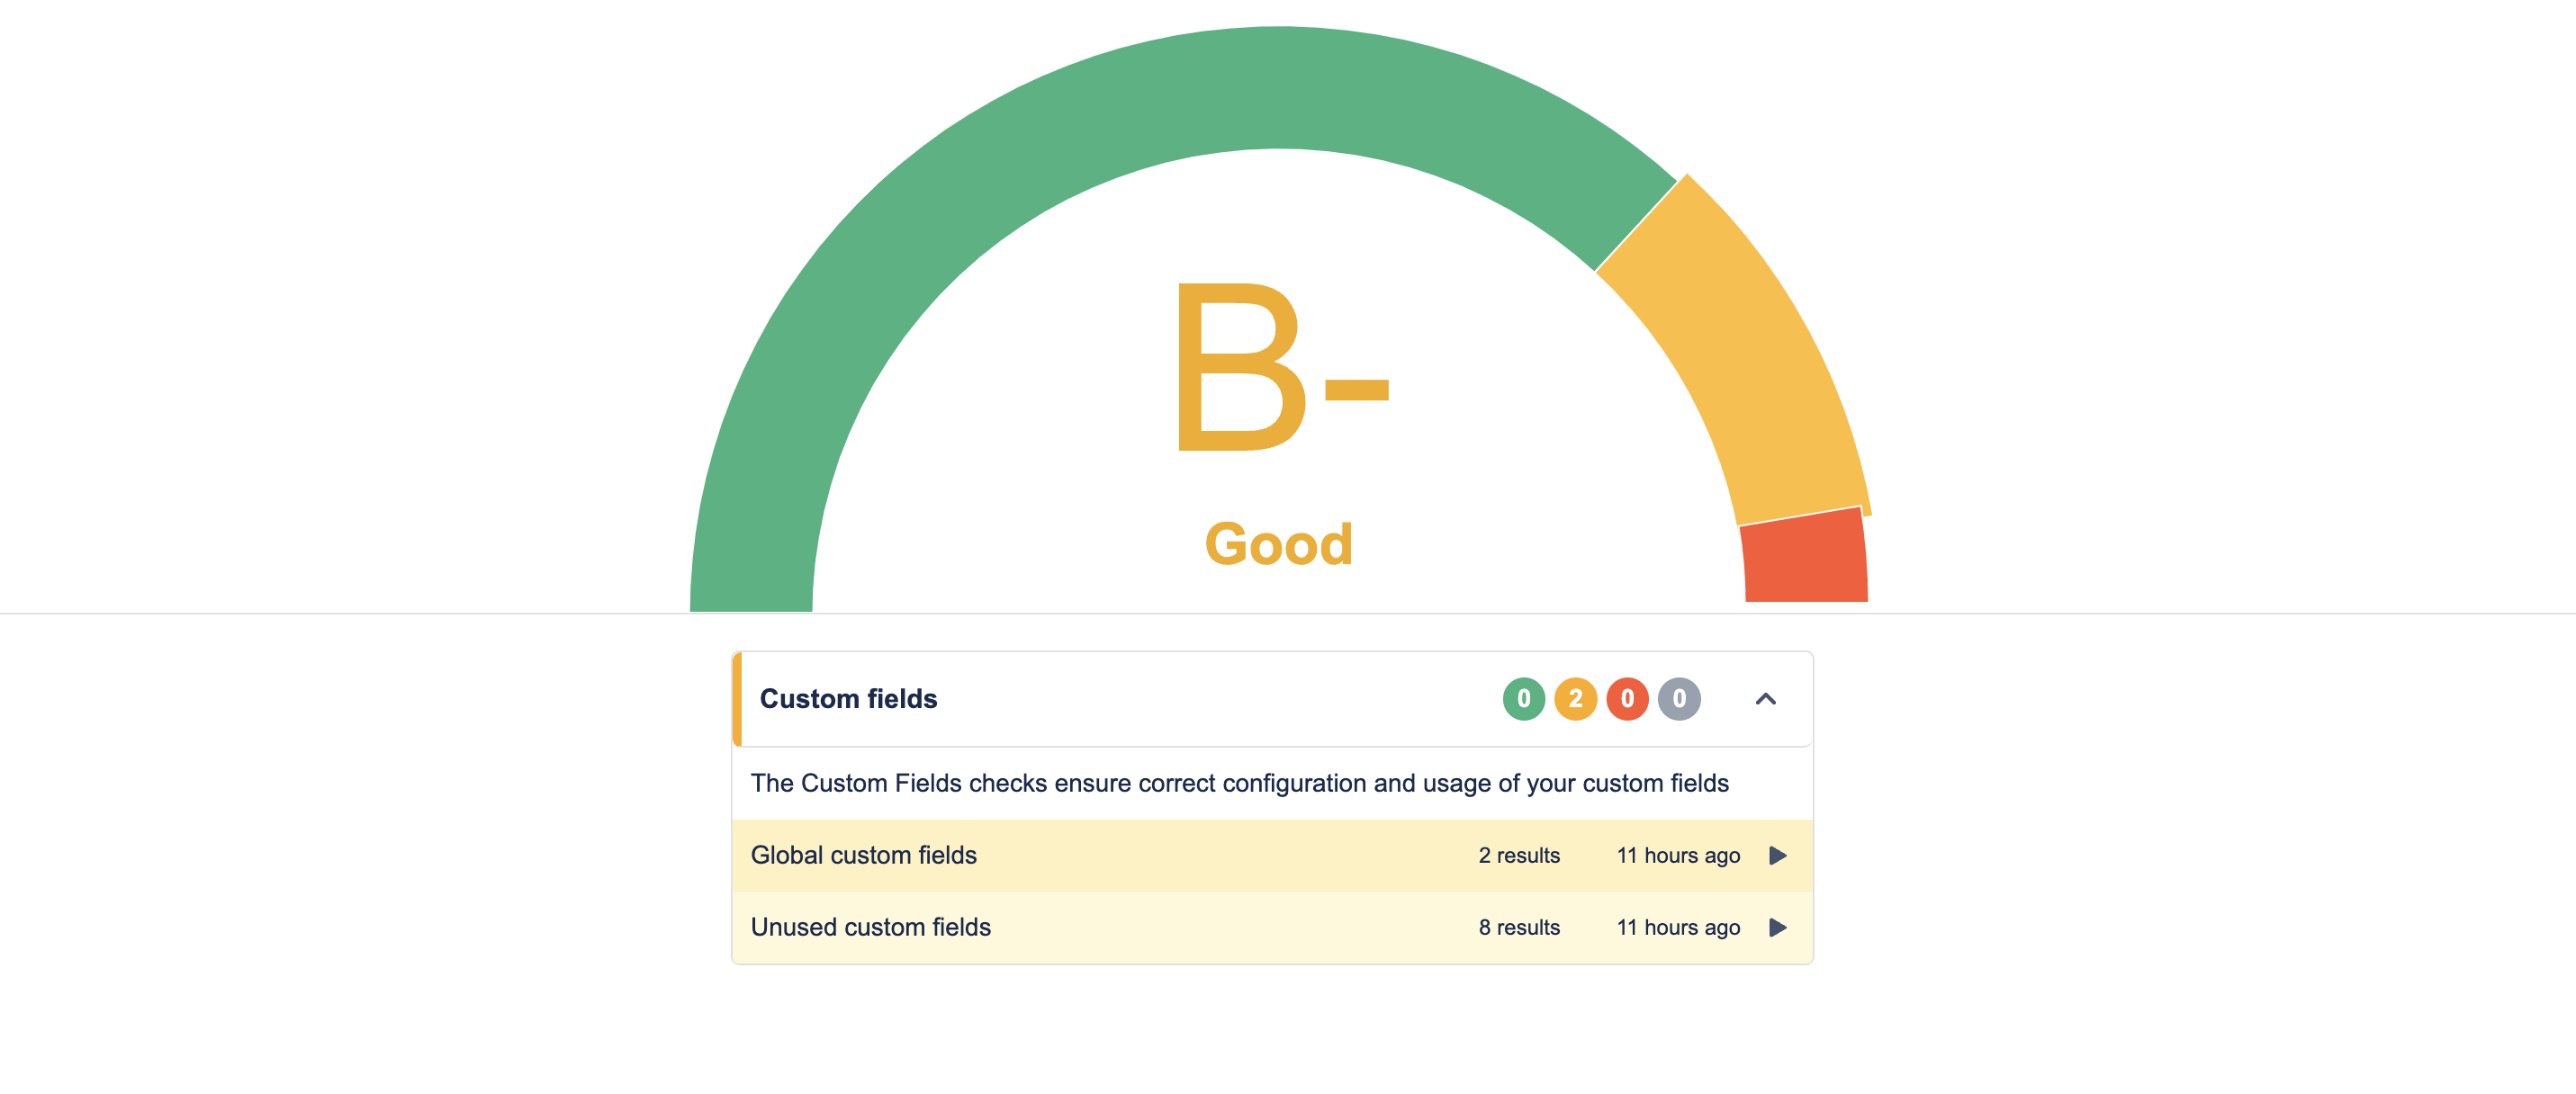
Within each collection, you can click onto any of the rows to find out more detail about the results. This will open a window that displays the description of each Health Check along with a summary of the results, as shown below.
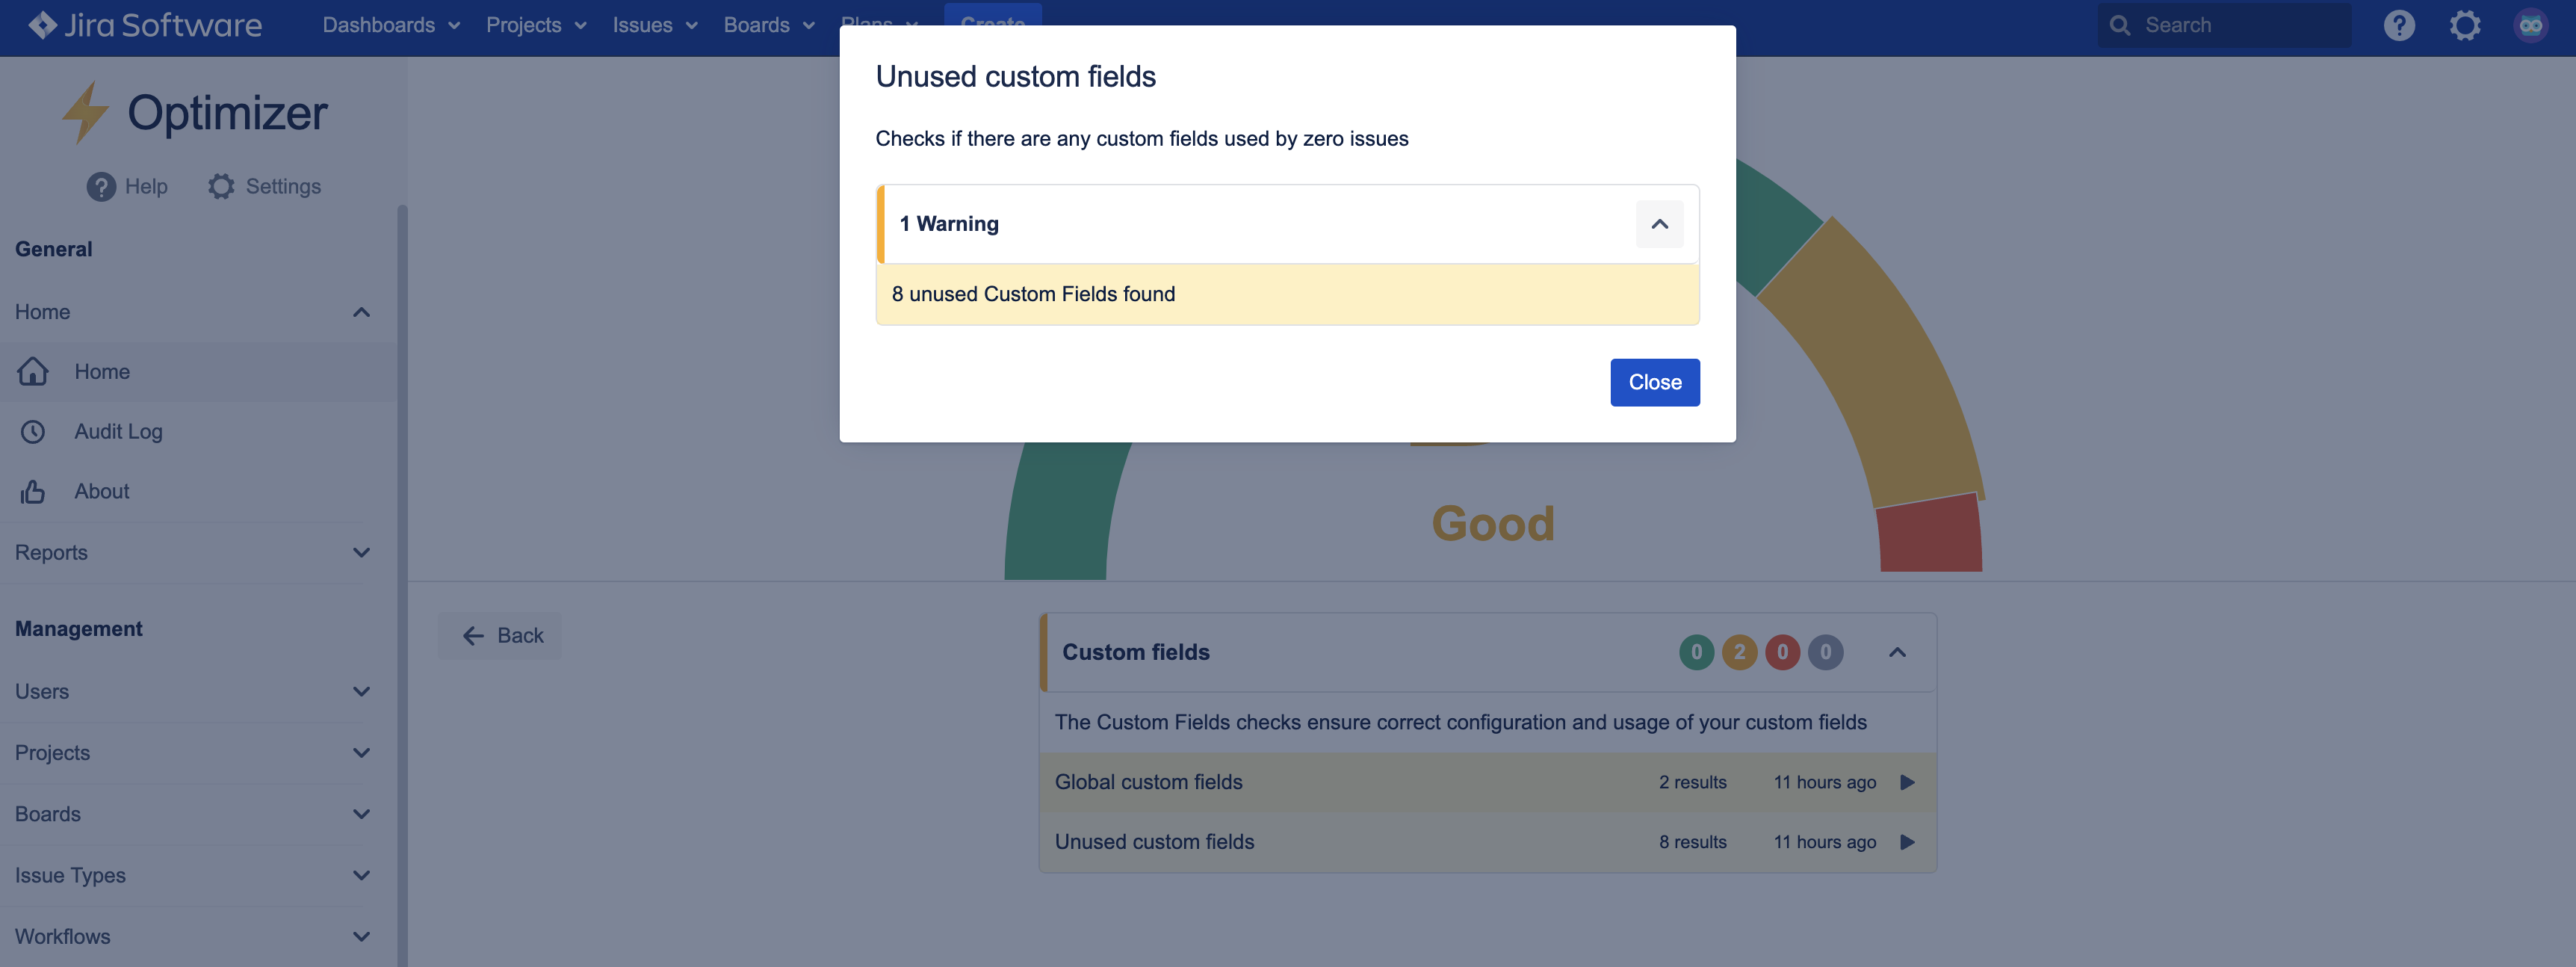
You can click the row to deep dive even further. In this example, we are going to click on the “8 unused Custom Fields found”, and it will take us to a smart table where these fields are displayed.
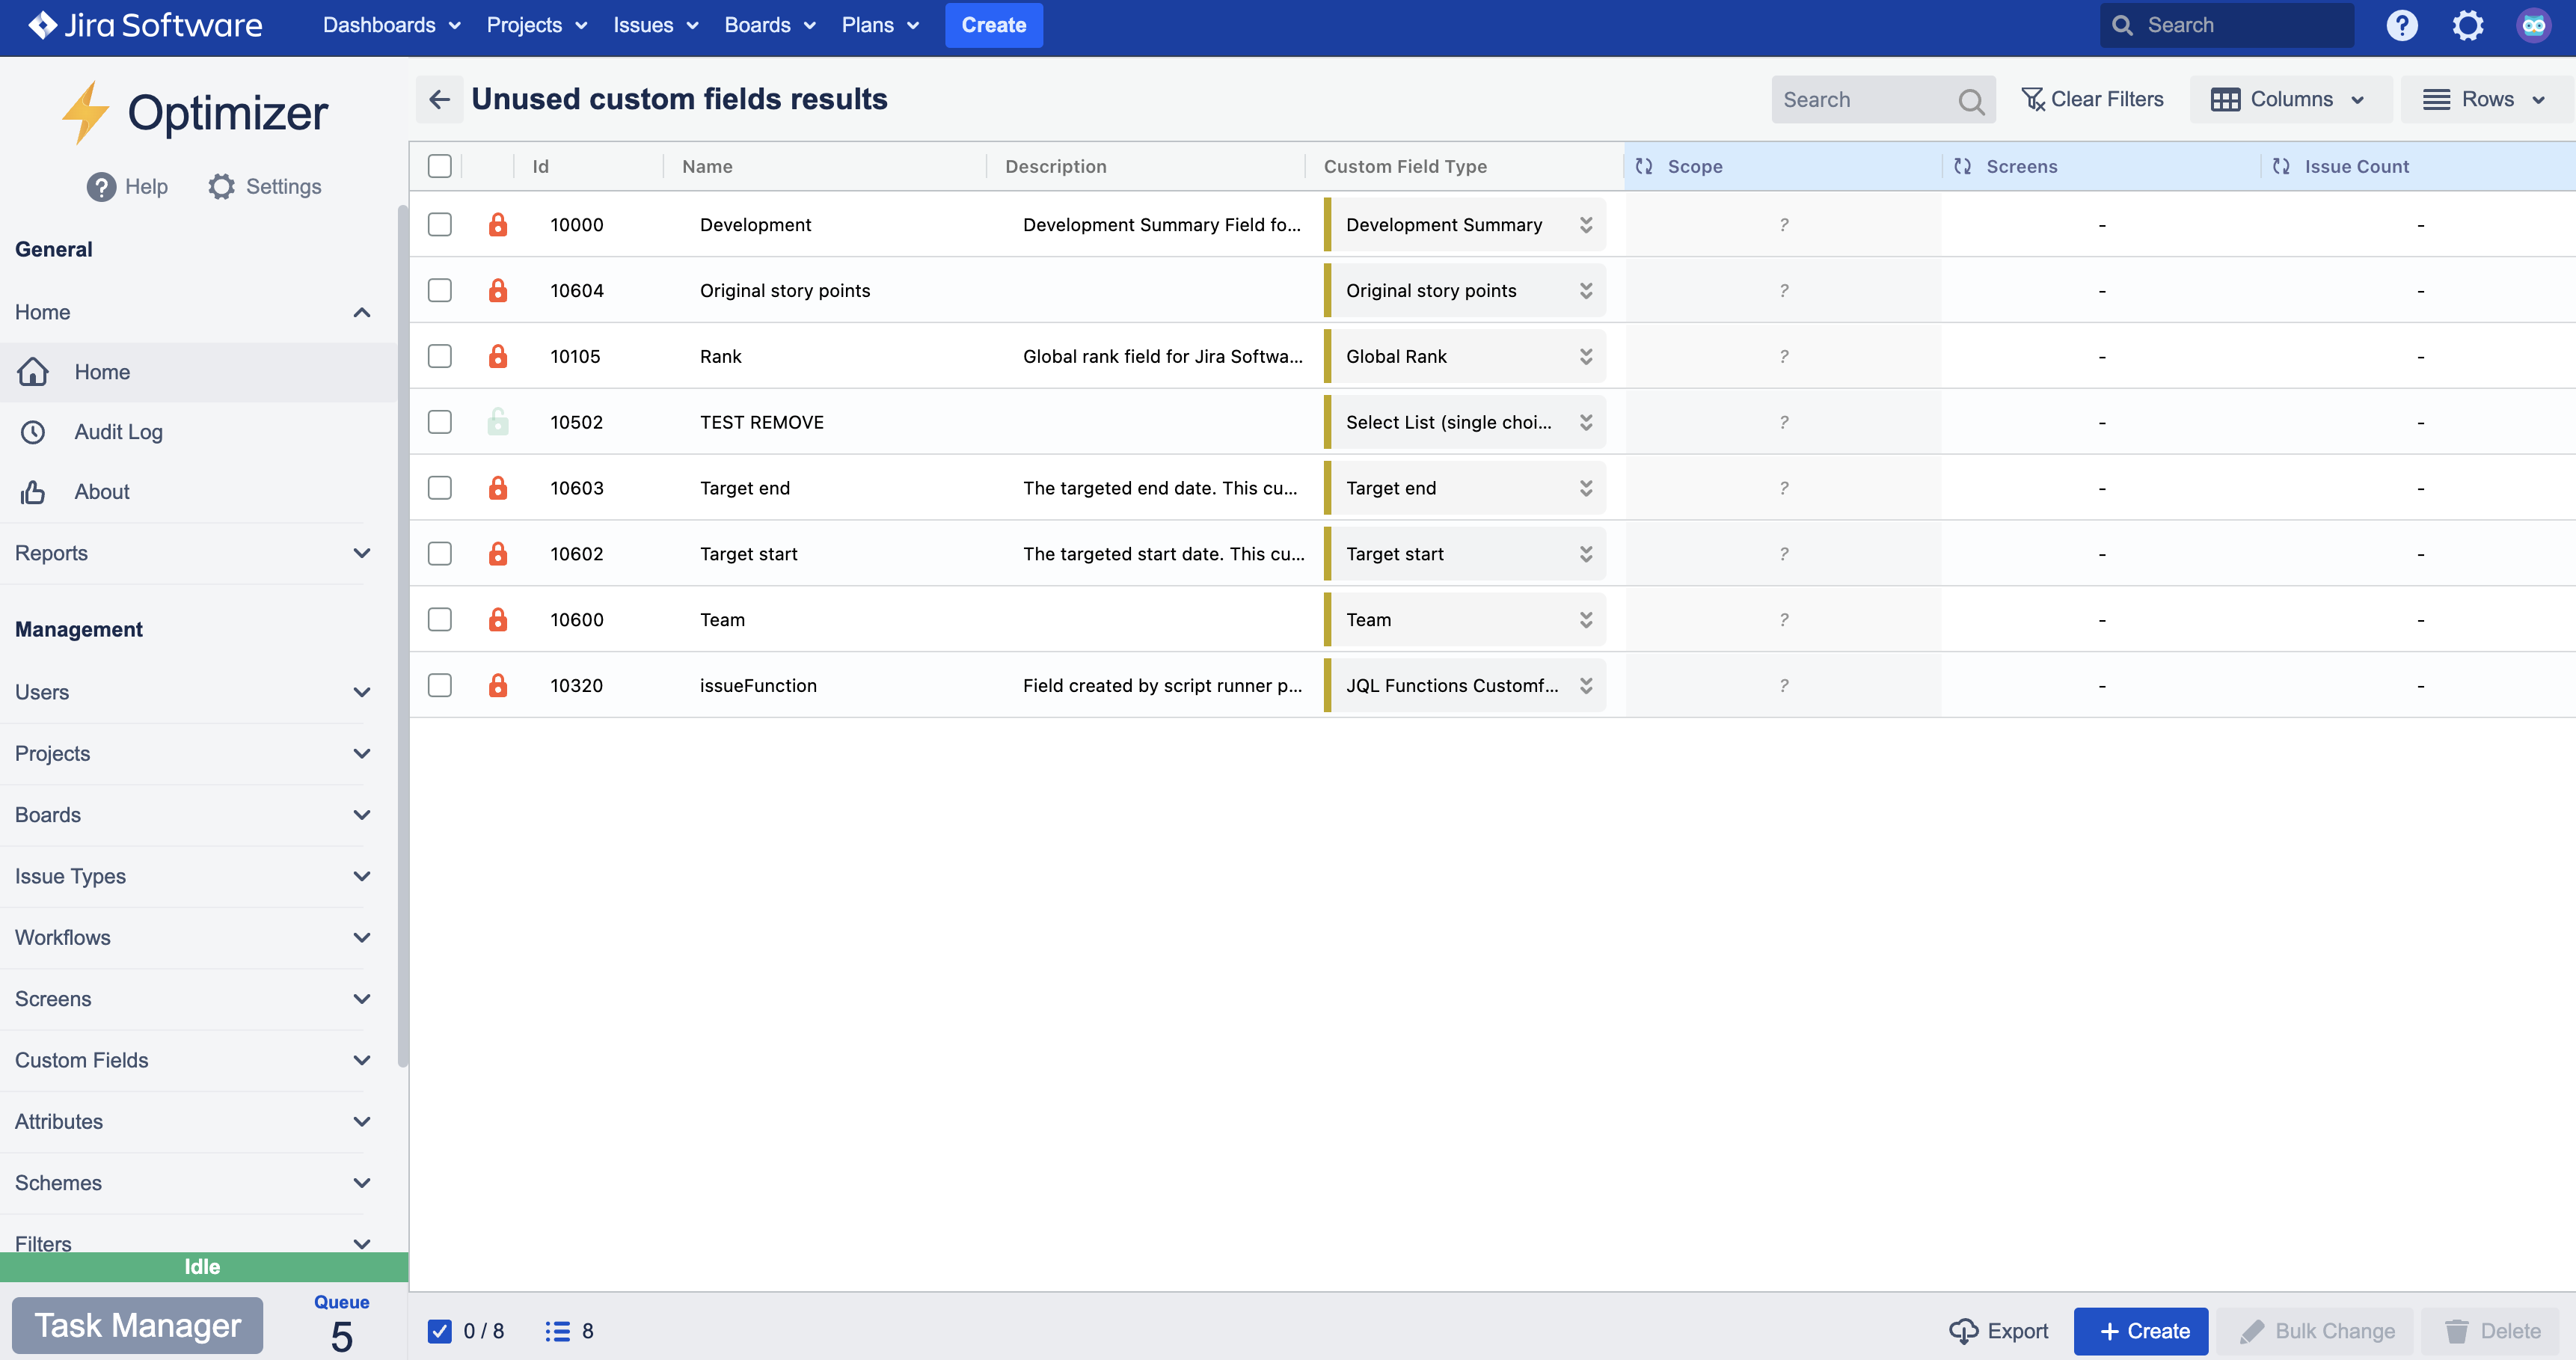
Once you have reached the smart table, it operates like the other smart tables in Optimizer. You can easily configure and delete individual or multiple custom fields within this one place, and it makes the maintenance process really easy for Jira admins.
You can find more information about Optimizer’s smart tables here.
Configuring Health Checks
You can configure all the Health Checks in Optimizer to match your preferences through the ⚙️ Settings. The settings can be accessed in the left-hand navigation menu or within the Health Checks section itself, as shown below.
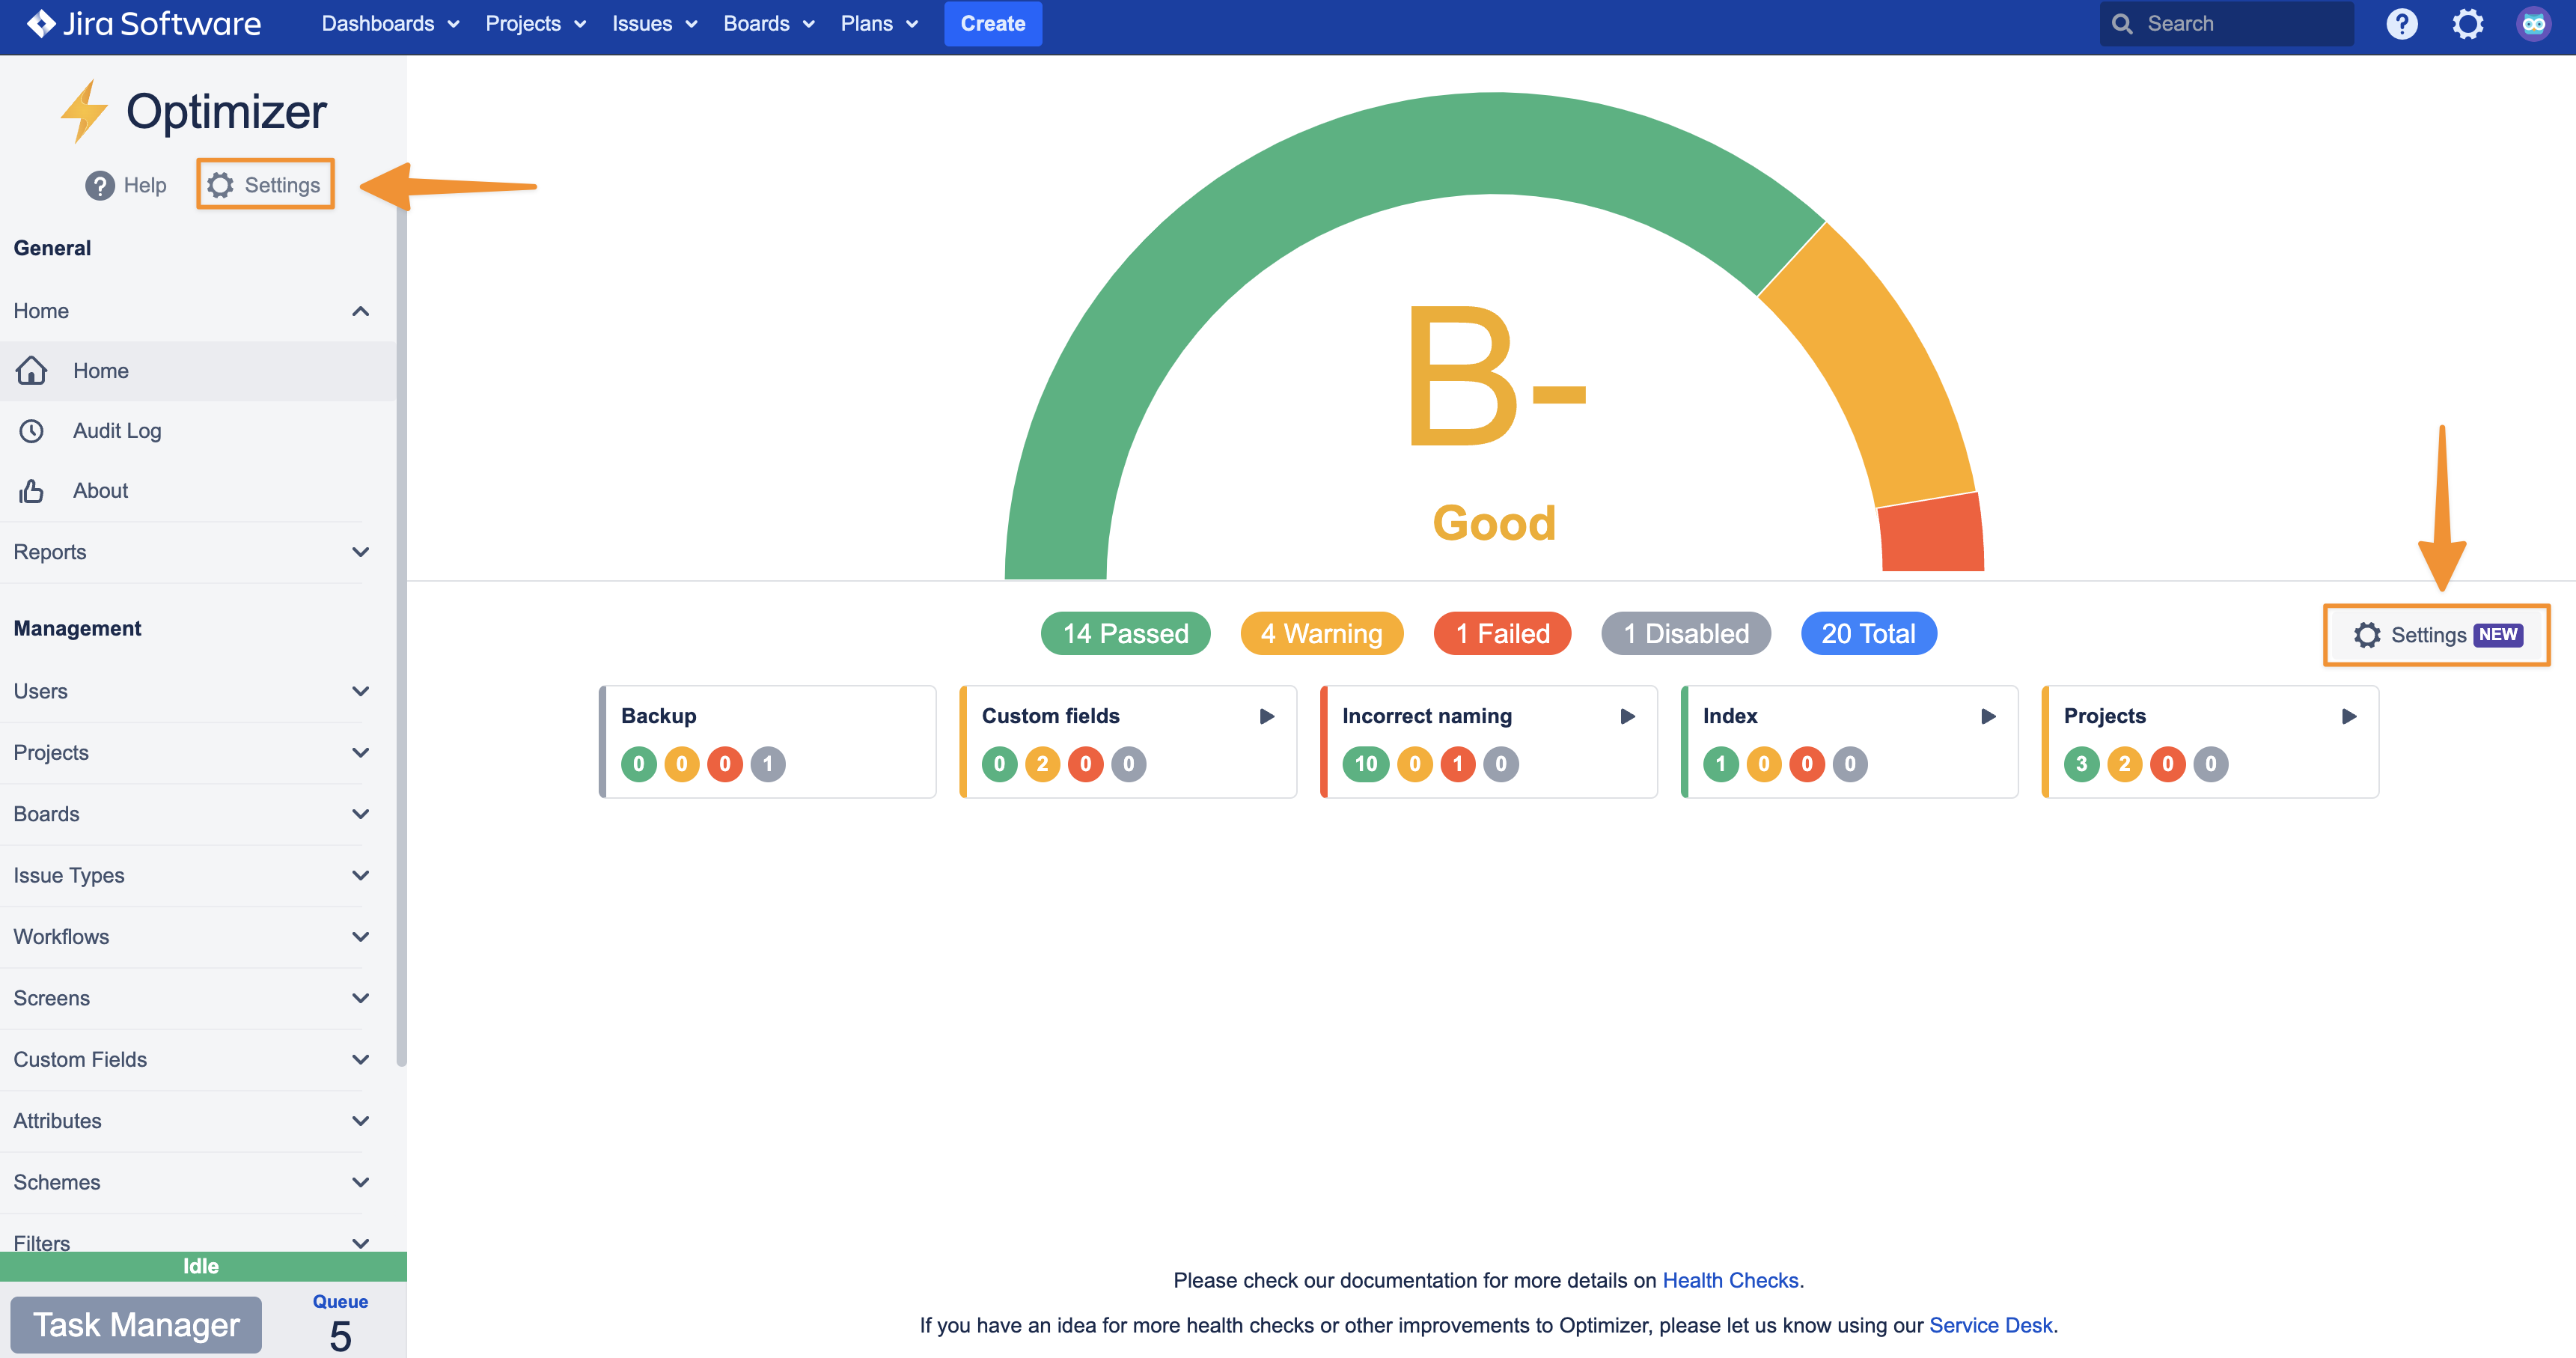
You can adjust and update the parameters of each Health Check as you desire, and once complete, press Save to confirm and activate the changes.

Each configuration can be expanded to provide more options for customization. You can also activate and de-activate each health check using these Settings.
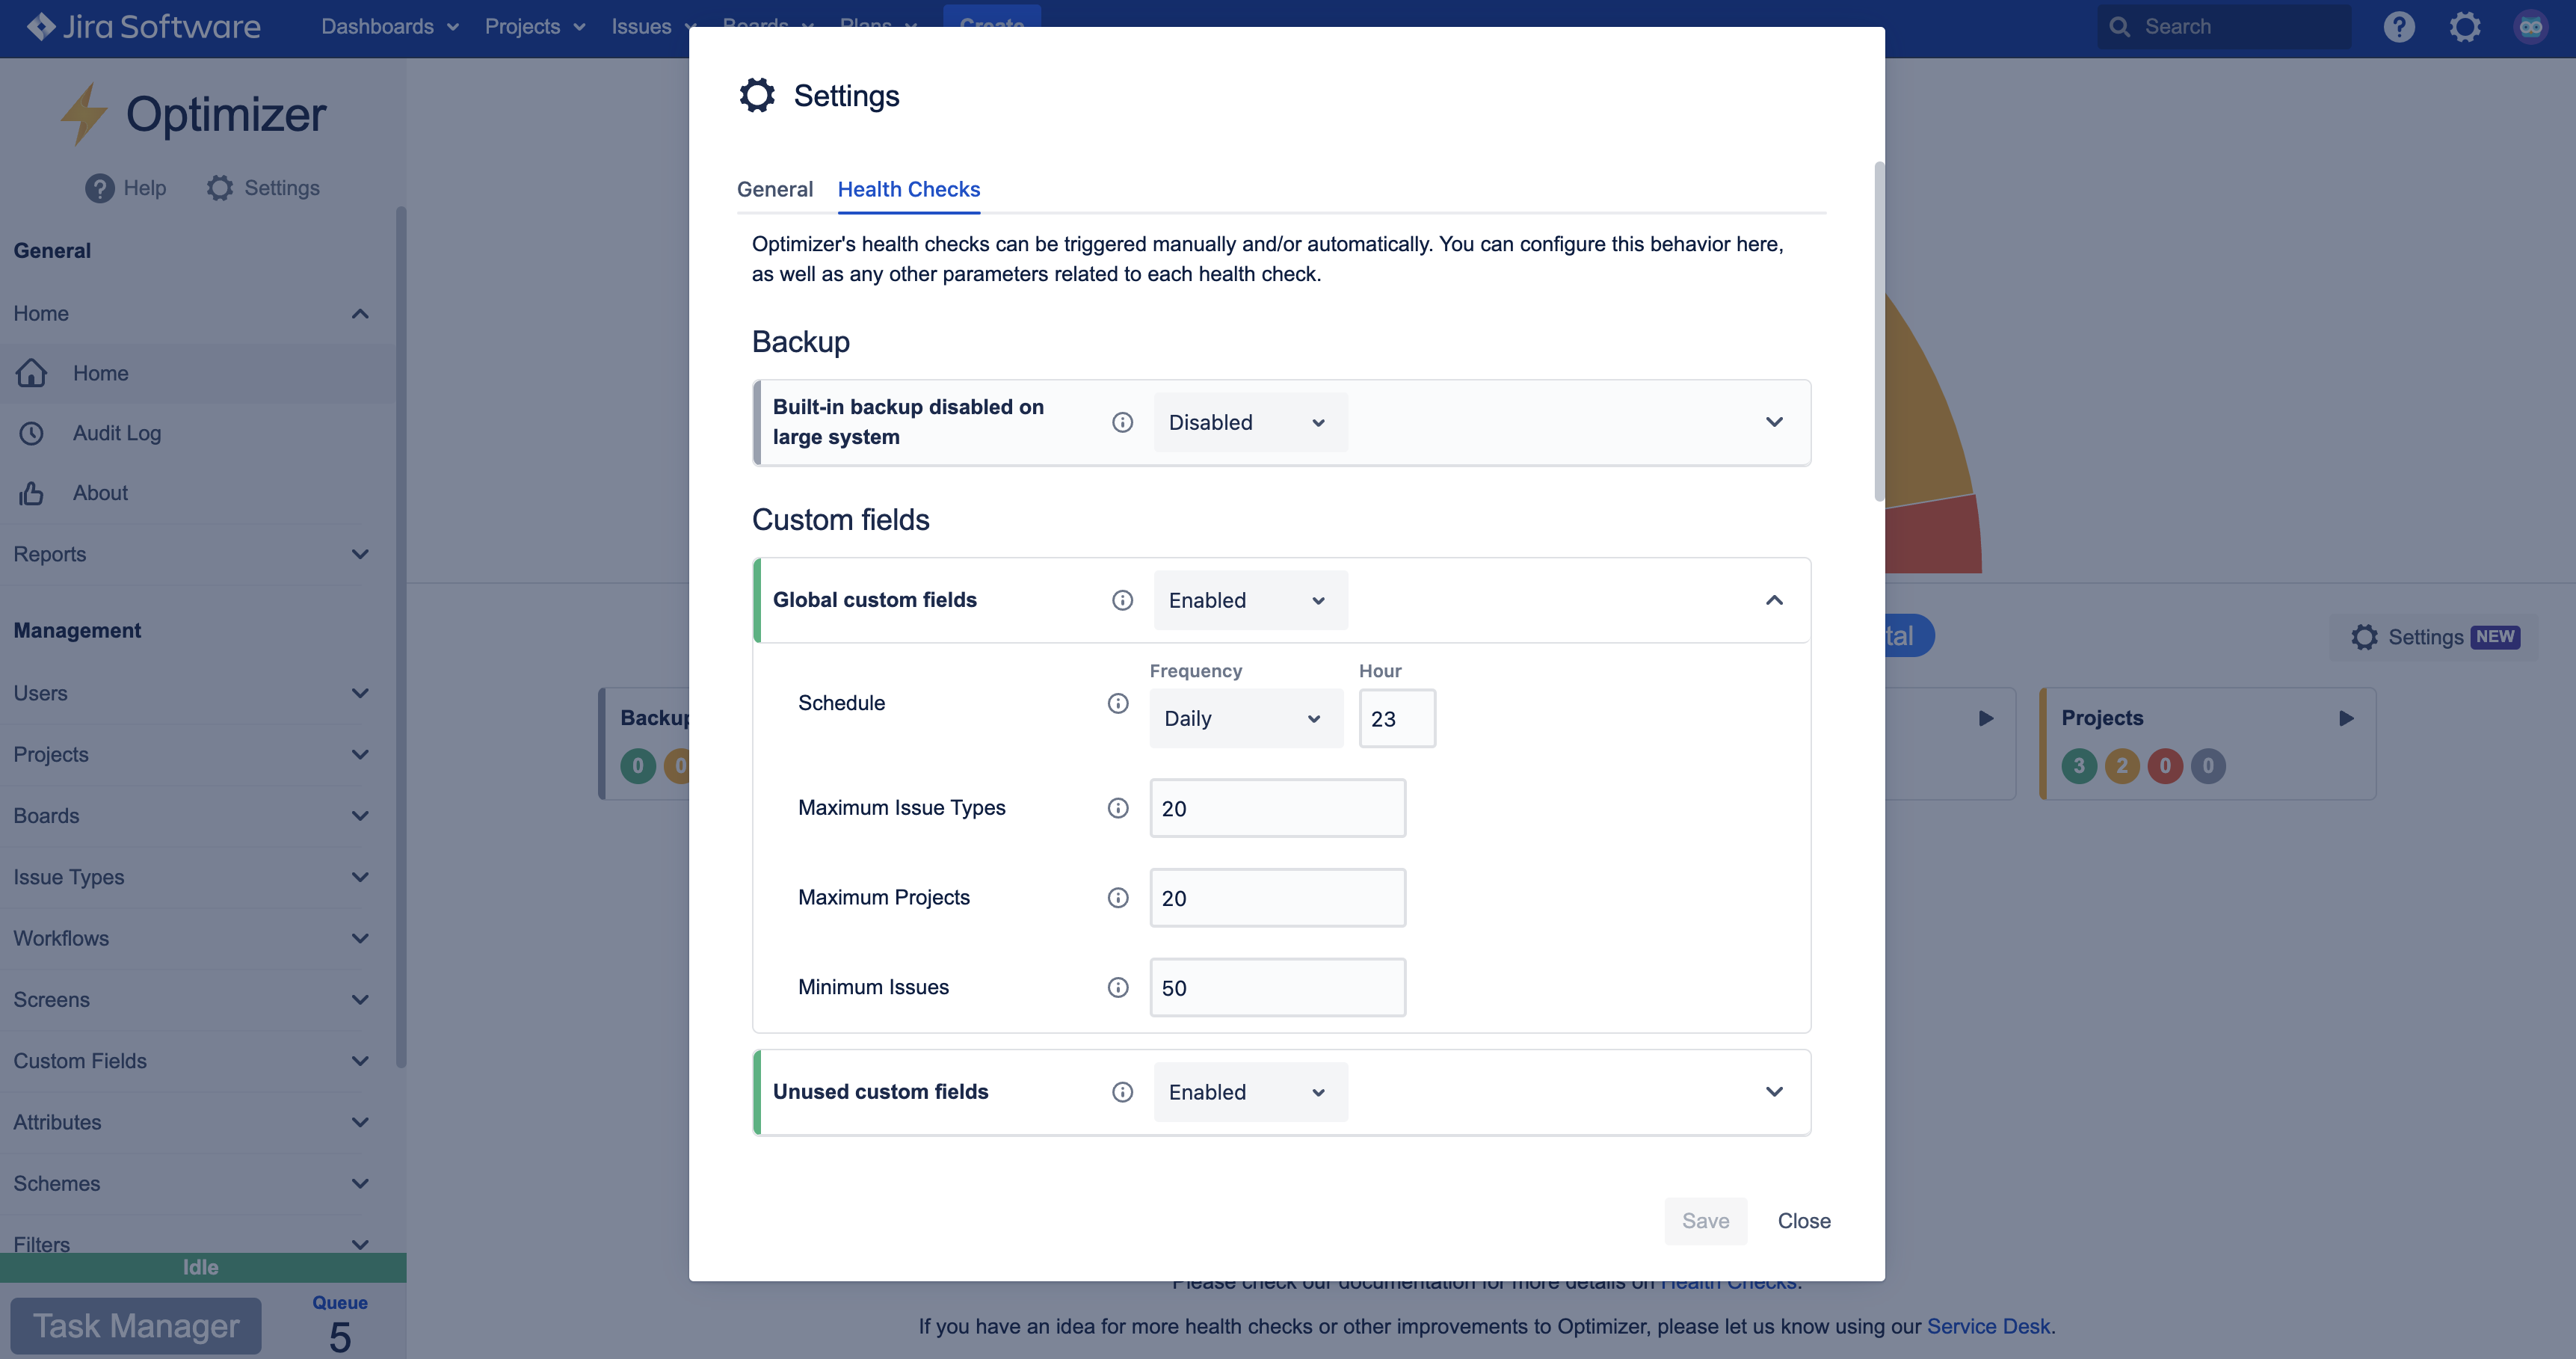
Enabling and Disabling Health Checks
You can easily enable or disable a Health Check within the Settings. There are 3 possible states for each Health Check:
-
Enabled - the health check will run automatically according to the schedule and when run manually
-
Manual Only - the health check will not run automatically, only when manually triggered
-
Disabled - the health check will not run automatically and cannot be manually triggered
Scheduling Health Checks
You can control how often the Health Checks will automatically run (if enabled). This setting allows you to select the frequency (hourly, daily, weekly, or monthly) and time (for instance, hour of the day), that the Health Check will run in your Jira site.
Once you have selected the desired frequency and time, press Save to confirm the selection.